Dividend growth investing is a simple but effective strategy. It is widely misunderstood too.
As a Dividend Growth Investor, I look for companies with a long history of annual dividend increases.
A long streak of consecutive annual dividend increases is typically an indication of a business with strong competitive advantages, good growth prospects, high returns on invested capital, and strong and recurring cash flows. A long streak of annual dividend increases is typical for companies with wide moats, which have tended to grow earnings per share for decades. As a long-term dividend investor, my goal is to identify such a business early in the game, buy it at an attractive price, and ride the economic trend for as long as possible. In other words, I am after companies that can grow earnings and dividends over time. I buy and hold forever, or in my case, for as long as they do not cut dividends.
Before doing so of course, I always review the company, its fundamentals and check the qualitative aspect of the business as well. Once I initiate a position, I also monitor the company for any major developments. But as part of my risk management process, I keep portfolio weights in check, and I very rarely would sell an existing position. I may not add to it if it stops meeting my entry criteria, which is guaranteeing a low allocation, as I build positions slowly and over time.
One of my favorite monitoring exercises is to check the list of dividend increases every week. That way, I get to see if my existing investments continue raising dividends, and if my thesis is still working. I also get to identify companies for future research through this exercise. In addition, I get to read the press releases and gauge managements sentiment towards the near-term prospects of the business.
My weekly review focuses on companies that have increased distributions for at least ten years in a row. During the past week, the four companies that raised dividends include:
Lowe's Companies, Inc. (LOW) operates as a home improvement retailer in the United States, Canada, and Mexico.
The company increased its quarterly dividend by 9.10% to 60 cents/share. This marked the 58th year of consecutive annual dividend increases for this dividend king. During the past decade, Lowe's has managed to increase dividends at an annualized rate of 19.40%.
Between 2010 and 2020, Lowe’s managed to grow earnings from $1.21/share to $5.49/share. Lowe's is expected to generate $8.31/share in 2021.
The stock is selling for 19.50 times forward earnings and yields 1.50%. Check my analysis of Lowe’s for more information about the company.
Atrion Corporation (ATRI) develops, manufactures, and sells products for fluid delivery, cardiovascular, and ophthalmology applications in the United States, Germany, and internationally.
The company increased its quarterly dividend by 12.90% to $1.75/share. This marked the 18th consecutive annual dividend increase for this dividend achiever. Over the past decade, Atrion has managed to increase dividends at an annualized rate of 15.95%.
Atrion managed to grow earnings from $8.36/share in 2009 to $19.73/share in 2019.
The stock is selling for 35 times earnings and yields 1.05%
Community Bank System, Inc. (CBU) operates as the bank holding company for Community Bank, N.A. that provides various banking and other financial services to retail, commercial, and municipal customers. It operates through three segments: Banking, Employee Benefit Services, and All Other.
The company raised its quarterly dividend by 2.45% to 42 cents/share, marking the 29th year of annual dividend increases for this dividend champion. During the past decade, it has managed to increase dividends by 5.80%/year.
The company managed to grow earnings from $1.26/share in 2009 to $3.23/share in 2019. Community Bank System is expected to generate $3.01/share in 2020.
The stock sells for 19.40 times forward earnings and yields 2.90%
American Financial Group, Inc. (AFG) is an insurance holding company, provides property and casualty insurance products in the United States. The company operates through three segments: Property and Casualty Insurance, Annuity, and Other.
The company hiked its quarterly dividend by 11.10% to 50 cents/share, marking the 15th consecutive annual dividend increase for this dividend achiever. Over the past decade, it has managed to increase dividends at an annualized rate of 12.20%.
Between 2009 and 2019, earnings rose from $4.45/share to $9.85/share. American Financial Group is expected to generate $6.60/share in 2020.
The stock sells for 9.55 times forward earnings and yields 3.10%.
Relevant Articles:
- The predictive value of rising dividends
- Strong Brands Grow Dividends
- Eight Companies Raising Dividends to Shareholders
Monday, August 24, 2020
Sunday, August 23, 2020
Lowe's (LOW) Dividend Stock Analysis for 2020
Lowe's Companies, Inc. (LOW), together with its subsidiaries, operates as a home improvement retailer in the United States, Canada, and Mexico. The company offers a line of products for construction, maintenance, repair, remodeling, and decorating.
Lowe’s is one of 28 dividend kings in the US. The company last hiked its quarterly dividend by 9.10% to 60 cents/share in August 2020. This marked the 58th consecutive annual dividend increase for the dividend king. Over the past decade, the company has managed to increase distributions at an annualized rate of 19.40%.

The strong growth in dividends per share was aided by growth in earnings per share and the increase in the dividend payout ratio over the past decade.
Between 2010 and 2020, earnings per share rose at an annualized rate of 16.30%/year. Lowe’s grew earnings per share from $1.21 in 2010 to $5.49 in 2020. The company is expected to generate $8.31/share in 2021, but in the current environment, estimates are a challenge.

Lowe’s is in the process of exiting its Mexico operations, closing Orchard Supply Hardware and closing underperforming stores in Canada and the US. Getting out of the ancillary businesses, closing underperforming businesses and concentrating on key operations in home improvement and enhancing the website functionality should help in focusing its efforts on key competencies. The company is working on a transformational initiative to improve stores, do a better job in inventory control, reign in SG&A spending, and improving supply chains. An increase in margins can improve profitability for each dollar of sales. It looks like the company will be relying less on growth through new stores, and more on doing better with the store base it already has.
The company’s fortunes are tied to the housing market in North America. A strong housing market will provide better sales over time. Growth in housing prices over time will provide a wealth effect, which can be transformed into higher spending on homes. As houses age over time, homeowners will spend more funds maintaining their places of living. Living in a house will tell you that the number of house projects never ends, as things break or get into the need for improvements, remodeling and renovations. An uptick in construction can benefit Lowe’s.
While the earnings growth during the past decade has been impressive, we should not forget that Lowe’s is exposed to the cyclical nature of the economy. During the past recession for example, earnings dropped from $1.99/share in 2007 to $1.20/share in 2010.
Lowe’s is second to Home Depot, which has slightly better store locations, higher margins, and a higher share of the professionals market. Better execution at Lowe’s can help in attracting more DIY customers and those from the Pro-segment. Investing in better customer service can pay dividends down the road, as better trained associates can broaden the moat behind the retailer operations. The ability to order online and pick-up in store is helpful in having successful online operations, while fending off threats from Amazon.
The company has been active on the share repurchase front during the past decade. The number of shares outstanding has gone from 1.465 billion in 2009 to 768 million by 2020. Most of the repurchases occurred between 2013 – 2020, when the share price was going up.

I find Lowe’s to be fairly valued today, mostly because the earnings estimates are up so much due to the increase in sales and earnings around the shut-downs. A lot of smaller competitors were closed during the lockdowns, and many may go out of business. As a result, Lowe’s and Home Depot took business from competitors. This further solidified their competitive positions. Additional time at home also fueled demand for DIY renovation projects. Further growth is stimulated by the growth in construction activity.
If the economy goes into a recession, I expect that Lowe’s will halt share buybacks, until the coast is clearer.
Either way, the buybacks have made each remaining share more valuable, thus boosting earnings per share.
The dividend payout ratio has increased from 23% in 2009 to 39% in 2020. The increase in the payout ratio has definitely helped Lowe’s grow distributions faster than earnings. It looks like between 2012 and 2019 however the payout ratio has not increase by much, which means that dividend growth was closely following earnings growth for a better part of the past decade.

Right now, the stock sells for 19.50 times forward earnings and yields 1.50%. In comparison, Home Depot is trading at 25.30 times forward earnings and yields 2.10%. I find Lowe’s to be fairly valued today, mostly because the earnings estimates are up so much due to the increase in sales and earnings around the shut-downs..
Relevant Articles:
- Home Depot (HD) Dividend Stock Analysis
- How to select winning retail stocks
- 36 Dividend Aristocrats On My Shopping List
- Dividend Kings List
Lowe’s is one of 28 dividend kings in the US. The company last hiked its quarterly dividend by 9.10% to 60 cents/share in August 2020. This marked the 58th consecutive annual dividend increase for the dividend king. Over the past decade, the company has managed to increase distributions at an annualized rate of 19.40%.
The strong growth in dividends per share was aided by growth in earnings per share and the increase in the dividend payout ratio over the past decade.
Between 2010 and 2020, earnings per share rose at an annualized rate of 16.30%/year. Lowe’s grew earnings per share from $1.21 in 2010 to $5.49 in 2020. The company is expected to generate $8.31/share in 2021, but in the current environment, estimates are a challenge.
Lowe’s is in the process of exiting its Mexico operations, closing Orchard Supply Hardware and closing underperforming stores in Canada and the US. Getting out of the ancillary businesses, closing underperforming businesses and concentrating on key operations in home improvement and enhancing the website functionality should help in focusing its efforts on key competencies. The company is working on a transformational initiative to improve stores, do a better job in inventory control, reign in SG&A spending, and improving supply chains. An increase in margins can improve profitability for each dollar of sales. It looks like the company will be relying less on growth through new stores, and more on doing better with the store base it already has.
The company’s fortunes are tied to the housing market in North America. A strong housing market will provide better sales over time. Growth in housing prices over time will provide a wealth effect, which can be transformed into higher spending on homes. As houses age over time, homeowners will spend more funds maintaining their places of living. Living in a house will tell you that the number of house projects never ends, as things break or get into the need for improvements, remodeling and renovations. An uptick in construction can benefit Lowe’s.
While the earnings growth during the past decade has been impressive, we should not forget that Lowe’s is exposed to the cyclical nature of the economy. During the past recession for example, earnings dropped from $1.99/share in 2007 to $1.20/share in 2010.
Lowe’s is second to Home Depot, which has slightly better store locations, higher margins, and a higher share of the professionals market. Better execution at Lowe’s can help in attracting more DIY customers and those from the Pro-segment. Investing in better customer service can pay dividends down the road, as better trained associates can broaden the moat behind the retailer operations. The ability to order online and pick-up in store is helpful in having successful online operations, while fending off threats from Amazon.
The company has been active on the share repurchase front during the past decade. The number of shares outstanding has gone from 1.465 billion in 2009 to 768 million by 2020. Most of the repurchases occurred between 2013 – 2020, when the share price was going up.
I find Lowe’s to be fairly valued today, mostly because the earnings estimates are up so much due to the increase in sales and earnings around the shut-downs. A lot of smaller competitors were closed during the lockdowns, and many may go out of business. As a result, Lowe’s and Home Depot took business from competitors. This further solidified their competitive positions. Additional time at home also fueled demand for DIY renovation projects. Further growth is stimulated by the growth in construction activity.
If the economy goes into a recession, I expect that Lowe’s will halt share buybacks, until the coast is clearer.
Either way, the buybacks have made each remaining share more valuable, thus boosting earnings per share.
The dividend payout ratio has increased from 23% in 2009 to 39% in 2020. The increase in the payout ratio has definitely helped Lowe’s grow distributions faster than earnings. It looks like between 2012 and 2019 however the payout ratio has not increase by much, which means that dividend growth was closely following earnings growth for a better part of the past decade.
Right now, the stock sells for 19.50 times forward earnings and yields 1.50%. In comparison, Home Depot is trading at 25.30 times forward earnings and yields 2.10%. I find Lowe’s to be fairly valued today, mostly because the earnings estimates are up so much due to the increase in sales and earnings around the shut-downs..
Relevant Articles:
- Home Depot (HD) Dividend Stock Analysis
- How to select winning retail stocks
- 36 Dividend Aristocrats On My Shopping List
- Dividend Kings List
Thursday, August 20, 2020
Long Term Investors Needed
"The investor's chief problem, and even his worst enemy, is likely to be himself."
-Benjamin Graham
I recently found an interesting chart, which shows the average length of time that investors hold their stocks for.
It looks like the average holding period for stocks has been on the decline over the past three or four decades.

It is of little surprise, if you understand basic economics of course. As the cost to buy and sell stocks decreased to pretty much zero, you will get a higher demand for the service and a higher volume at the lower price point. It is much easier to buy and sell stock today, versus the 1980s or the 1990s, when you had to call a broker, who would then have to call someone on the floor of the NYSE or AMEX or enter the order on NASDAQ. Then you would have to get paper certificates shuffled between brokers, and perhaps even finding their ways to te customer's home.
The ease of access and elimination of cost to invest has made it easier to trade. But that ease may be counter-productive for investment results. Most investors are better off assembling a diversified portfolio of blue chip stocks either directly, or by buying a diversified ETF, and then simply holding on to that investment. We as investors have never had it easier, since we have unlimited access to information at the same time as investment professionals, and we can buy and sell stocks easily at the click of a button. It has never been easier to build your own portfolio at no cost, and keep adding to it on a regular basis until you reach your financial goals and objectives.
However, all this information and noise makes us want to act and speculate. Most speculators end up losing money. A study I read a few years ago found that the investors who made the most trades in a given quarter had the lowest returns. The study is aptly titled "Trading Is Hazardous to Your Wealth"
It made sense in the old days that trading too much was costly, because you paid a lot in commissions. However, there is a bigger cost, which is behavioral. There are certain advantages of being a long-term investor. Shortening your time horizont over time turns those into massive disadvantages that you have to overcome.
The ease at which you can buy and sell stocks may cause you to overtrade. Most people who trade actively, lose money. Instead of focusing your attention on building a diversified portfolio and hold for the long-term, you end up speculating. I believe that the best way for the average person to make money in the stock market is buy buying a diversified portfolio of quality stocks either directly or through an ETF, and then sitting on it. That way they are letting the power of compounding doing the heavy lifting for them.
If you sell a perfectly good stock for no other reason than because it is easy to do so, you may be shooting yourself in the foot. After all, it is difficult to know in advance which would be the best companies in your portfolio 10 or 20 years from now. The problem is that a small number of companies in a portfolio would likely account for a large majority of future returns. Accidentally selling one of the big winners in your portfolio early in the game may be the difference between having a successful investment experience or having a mediocre investment experience that causes you to have to work for longer than you have to.
If it is very easy to sell stocks, many investors may be tempted to sell at the first sign of trouble. They may also sell otherwise good companies, because they may want to buy something that is flashier and is moving faster. This ability to sell stocks quickly may turn the average person from a long-term investor into a shorter-term speculator. I am rambling, but I do believe that having a long-term focus in investments can be beneficial. Most approach investing the same way they are buying lottery tickets. Perhaps people are forgetting that a stock is not a piece of paper of a ticker on a computer screen, but an ownership claim to a real business.
I have shared the story of the millionaire janitor Ronald Read several times on the site. He never made a high salary, yet he managed to accumulate a dividend portfolio worth $8 million, which also paid him a quarterly dividend of $60,000. He succeeded by buying and holding a diverse group of established blue chip companies that paid dividends and raised them regularly.
Some of the companies he held succeeded tremendously, while others failed. It was a slow but steady approach that focused on the slow and steady growth and reinvestment for companies with recurring cash flows that grew at a sustainable pace over long periods of time. These were companies to own for decades, as they quierly compounded earnings, dividends and intrinsic values. Despite owning Lehman Brothers, his portfolio still succeeded, because he had a lot of other great companies that picked up the slack. He simply bought stock regularly, and reinvested his dividends.
What may have helped Ronald Read, and influence his behavior towards long-term thinking was the fact that he held most of his stock in stock certificates. Decades ago, when you bought stock, you called a broker and had paper certificates delivered to your broker or to you. As a result, selling because more cumbersome. But incidentally, when certain things are not easy, most people would just hold on to them. Which makes silly behavior such as selling a good company for no good reason than the fact that it is easy to do (acting on noise is basically letting you sell quickly for no reason). Incidentally, holding stock in the form of paper certificates may have further reinforced his strong conviction to be a patient buy and hold investor. I believe that we could all benefit from this type of thinking.
The reduction in fees and commissions has been great for long-term investors like us. It basically costs practically nothing to assemble and hold a portfolio of dividend paying stocks. The downside is that the ease of access and no commissions increase the temptation to go and trade stocks, which can result in behavioral costs to returns.
Good things take time to happen. By having a long-term mindset, we are more likely to capture the gradual business growth over time. Your goal as an investor is to own them, not to rent them.
Relevant Articles:
- How to think like a long term dividend investor
- The advantages of being a long-term dividend investor
- Dividend Growth Investing Promotes Long-Term Thinking
- How to improve your investing over time
Monday, August 17, 2020
Eight Companies Raising Dividends to Shareholders
I review the list of dividend increases as part of my monitoring process.
I review the most recent dividend increase, and compare it to the ten year average to gauge it. While I generally prefer a stable rate of dividend growth that is close to the average, I also understand that businesses face different short-term cycles as well.
I also review the growth in earnings, and payout ratios, in order to determine the likelihood of future dividend increases. A company that grows earnings and maintains a stable payout ratio will be more likely to continue growing that future dividend income stream to investors. On the other hand, a company with a stagnant earnings per share can only be able to grow dividends through an expansion to the payout ratio, which is unsustainable.
Last but not least, I also look at current valuation factors such as P/E ratio and dividend yield, while also taking into consideration the past growth and future growth prospects for each enterprise.
Broadridge Financial Solutions, Inc. (BR) provides investor communications and technology-driven solutions for the financial services industry worldwide.
Broadridge hiked its quarterly dividend by 6.50% to 57.50 cents/share. This marked the 14th consecutive annual dividend increase for this dividend achiever. Over the past decade, this dividend achiever has managed to grow distributions at an annualized rate of 19%.
Broadridge managed to increase earnings from $1.32/share in 2010 to $3.95/share in 2019
Broadridge Financial is expected to generate $5.45/share in 2020.
Right now the stock is selling for 25.50 times forward earnings. Broadridge Financial yields 1.70%. Check my analysis of Broadridge Financial for more information about the company.
Nordson Corporation (NDSN) engineers, manufactures, and markets products and systems to dispense, apply, and control adhesives, coatings, polymers, sealants, biomaterials, and other fluids worldwide.
Nordson increased its quarterly dividend by 2.60% to 39 cents/share, marking the 57th consecutive annual dividend increase for this dividend king. Over the past decade, it has managed to boost dividends at an annualized rate of 14.50%
The company grew earnings from $2.46/share in 2010 to $5.79/share in 2019.
The company is expected to earn $5.40/share in 2020. The stock is overvalued at 38.30 times forward earnings and yields 0.75%
Cboe Global Markets, Inc (CBOE) operates as an options exchange in the United States. It operates in five segments: Options, U.S. Equities, Futures, European Equities, and Global FX.
CBOE raised its quarterly dividend by 16.70% to 42 cents/share. This marked the 10th year of annual dividend increases for this newly minted dividend achiever. Over the past five years, CBOE has managed to increase dividends at an annualized rate of 11.40%.
Between 2010 and 2019, CBOE grew earnings from $1.03/share to $3.34/share. CBOE is expected to earn $5.19/share in 2020.
The stock is attractively valued at 17 times forward earnings and a dividend yield of 1.90%.
Westlake Chemical Corporation (WLK) manufactures and markets basic chemicals, vinyls, polymers, and building products worldwide. It operates through two segments, Olefins and Vinyls.
Westlake Chemical increased its quarterly dividend by 2.90% to 27 cents/share. This marked the 17th consecutive year of annual dividend increases for Westlake Chemical. Over the past decade, the company has managed to boost distributions at an annualized rate of 25%.
The company managed to grow earnings from $1.67/share in 2010 to $3.25/share in 2019
Westlake is expected to generate $1.54/share in 2020.
The stock is overvalued at 39.60 times forward earnings and offers a dividend yield of 1.80%.
International Flavors & Fragrances Inc. (IFF) manufactures flavors and fragrances for use in various consumer products. It operates through two segments, Taste and Scent.
The company increased its quarterly dividend by 2.70% to 77 cents/share. This marked the 18th year of annual dividend increases for this dividend achiever. Over the past decade, it has managed to grow distributions at an annualized rate of 11.50%
The company managed to grow earnings from $3.26/share in 2010 to $4/share in 2019.
International Flavors and Fragrances is expected to earn $5.74/share in 2020.
The stock is selling for 21.50 times forward earnings. The stock yields 2.50% today.
KLA Corporation (KLAC) designs, manufactures, and markets process control and yield management solutions for the semiconductor and related nanoelectronics industries worldwide.
The company increased its quarterly dividend by 5.90% to 90 cents/share. This was the 11th consecutive annual dividend increase for this dividend achiever. During the past decade, it has managed to boost distributions at an annualized rate of 17.80%
The company managed to increase earnings from $4.66/share in 2010 to $7.70/share in 2019.
KLA is expected to generate $11.41/share in 2020.
The stock is trading at 18.50 times earnings and yields 1.70%.
Chemed Corporation (CHE) provides hospice and palliative care services to patients through a network of physicians, registered nurses, home health aides, social workers, clergy, and volunteers in the United States. It operates through two segments, VITAS and Roto-Rooter.
Chemed raised its quarterly dividend by 6.25% to 34 cents/share. This marked the 12th year of consecutive annual dividend increases for this dividend achiever. In the past decade, it has managed to increase dividends at an annualized rate of 13.20%
Chemed managed to grow earnings from $3.55/share in 2010 to $13.31/share in 2019.
Chemed is expected to generate $16.35/share in 2020.
The stock sells for 31 times forward earnings and yields 0.30%.
Carlisle Companies Incorporated (CSL) operates as a diversified manufacturer of engineered products in the United States, Europe, Asia, Canada, Mexico, the Middle East, Africa, and internationally.
The company raised its quarterly dividend by 5% to 52.50 cents/share. This marked the 44th year of consecutive annual dividend increases for this dividend champion. During the past decade, it has managed to increase dividends at an annualized rate of 11%.
Carlisle companies managed to grow earnings from $2.34/share in 2010 to $8.19/share in 2019.
Carlisle Companies is expected to earn $5.53/share.
Right now the stock sells for 22.75 times forward earnings and offers a dividend yield of 1.70%.
Relevant Articles:
- Two Sweet Dividend Increases For Long-Term Shareholders
- Screening The Dividend Champions List For Bargains
- Six Companies Demonstrating A Commitment to Shareholder Returns
- Nine Dividend Paying Companies Raising Dividends Last Week
Thursday, August 13, 2020
Investing in Nasdaq 100 in 2000
There are two schools of thought when it comes to value investing.
The first school of thought is that value and growth are connected at the dot. You have to pay a higher multiple for future growth.
Another school of thought believes that you need to wait and not overpay for future growth.
Sometimes, the investors who wait to buy at the right price, and avoid overpaying tend to look very smart. Like avoiding buying Japanese stocks in 1989 or Tech stocks in 2000.
Other times, buying stocks at any price seems to be a winning combination. Like buying tech stocks in 2010, or 1990 or buying Japanese stocks in 1980.
Many investors today believe that stocks are overvalued. Others believe that stocks are priced correctly for the environment we are in.
We have all heard that stocks return 10%/year. This is correct for the stock market as a whole. But when you dig through on the individual security level, you can find that a lot of companies tend to not do very well. Some research found that most companies tend to do worse than Treasury bills. The great stock market returns are driven by a handful of companies that tend to push the fortunes of investors upwards.
Depending on how you view the data however, you can see that the largest companies that are profitable, tend to continue delivering profits to shareholders. This is perhaps why investing in well known large blue chip companies that make money has worked so well, and is so popular with DIY investors. Focusing on smaller and less known companies is more speculative, and this is precisely where the majority of companies with terrible returns tend to hang out.
If you look at a list of companies at the beginning of a period, and trace the results 10 or 20 years down the road, you get to see a very interesting observation. Notably, the paretto principle in action.
The paretto principle for equities should state that 20% of companies are responsible for 80% of equity returns. This is why you need to have great diversification, but also focus on quality too. While we do not know which the best companies over the next 20 years are going to be, we know that we need to diversify, and hopefully our portfolio as a whole should do ok.
This is a very interesting exercise for me to go through as well, because it does tell me that predicting future winners and losers from a list is very difficult. I've tried it before, but my success could have been due to luck, than skill.
This exercise also teaches me that investing is part art, part science. It also teaches me that the overall results from a portfolio would be dependent on a few big winners. So if I sell those winners early, that would mean that I would be stuck with a mediocre investment career. If I hold on to those winners, I may look like a winner at the end. The goal is to build a diversified portfolio, and stick to my holdings. I encourage investors to read more about the Coffee Can Approach.
In general, a low P/E ratio signals "value" to many investors. However, if a company with a low P/E ratio never grows earnings or even worse, its profits decline over time and even turn to losses due to challenging business conditions, it may turn out to be a value trap.
On the other hand, companies with high P/E ratios may signal "danger" to many investors. However, a company with a high P/E ratio that manages to grow earnings per share over time may turn out to have been a cheaper stock than a low P/E one.
Of course, while P/E ratio and dividend yield are relatively known today, the future growth of earnings and the business are tough to ascertain with any certainty.
The funny part is that neither of these approaches works all the time. Things are cyclical in nature. Sometimes the so called value approach works great, and it washes out the growth investors.
After that, the growth cycle comes into gear, and these companies and investors tend to smoke out any value investors.
Both can work, but over long periods of time. Even if your approach works eventually, it may be a very long and testing process, where the majority of results re not visible until the end.
For example, investing in the Nifty 50 in 1972 delivered similar results to investing in S&P 500 through 1998. Source: Valuing Growth Stocks: Revisiting the Nifty Fifty

That's despite the fact that the Nifty 50 sold at ridiculously high P/E ratios. It turned out that as a whole, these companies were priced right as a group, since their earnings growth more than compensated for the high P/E ratios. Of course, long-term investors had a long and trying time in the market, since the first decade after 1972 brought poor results, as these companies went back to more reasonable valuation. The valuation compression ate into returns in the first decade, despite the fact that these businesses were still growing profits. Ultimately, the long-term returns of these businesses were dependent on the underlying fundamentals growth in these businesses. If someone became scared or lost patience after a decade of poor or no returns, they would have bought high and sold low.
The results of two different investors in the same Nifty 50 stocks would have varied significantly based on their start/end timeframe. Someone who started in 1972 would have had their conviction tested in the first decade, before recovering and ultimately recovering nicely. However, if someone started just a few years later, they would have done fantastically. I often think about results we see, if we did one thing at a certain time versus another. Since we as humans learn from experience, it is interesting to observe how early success or failure would affect our psyche as investors. If you fail early on, you may give up, even if that failure may have been a simple test of conviction ( albeit with a 70% drawdown in 2 years). If we experience winning from the start, we may see things differently.
Let's think about value versus growth with another example. Between 1950 and 2003, Exxon had a lower rate of growth and a lower P/E than IBM. However, Exxon did better for its investors than IBM. Mostly because the dividends were reinvested back into a low P/E, low valuation. The stock was not overvalued relative to its earnings prospects.
Recently, we have the Nasdaq 100 reaching all time highs, which has made some investors very confused. After all, we are in the midsts of a global pandemic that would have far-reaching repercussions for the world economy for years down the road. The US GDP has contracted by the highest amount in Q2 2020, and we have the same situation for a large part of the developed world. Unemployment is high, and there are riots on the streets.
Plenty of investors see that news, and assume a bearish view. This view is reinforced by high valuations for stocks. Many are comparing the high valuations today with the Nifty Fifty from 1972, and the Dot Com bubble from 1999 - 2000.
Prof Jeremy Siegel has already discussed how investing in the original Nifty Fifty has done for investors through 1998. I decided to go back and see how a passive investor in the Nasdaq 100 would have done if they bought in January 2000. If we are in a similar situation as in 2000, perhaps studying how it turned out, may give us some ideas on how to proceed today.
If you bought Nasdaq 100 in 2000, you would have basically tripled your money by July 2020. This is not a bad deal, given the fact that tech stocks were ridiculously expensive in 2000. With sky-high P/E ratios that made little sense, but fueled by the belief in unlimited future growth prospects. Of course, to get there, you had to endure a long and grueling period of about 13 - 14 years, before breaking even. This would have tested the nerves of many investors.

It was fascinating for me to dig a little further. I was able to find the components for Nasdaq 100 companies in 2000. You can view the companies in the list below. It has it sorted by portfolio weight.

The next step I took was to calculate the returns for each company from January 1, 2000 to July 17, 2020. This is shown in the third column above. The column shows how a $10,000 investment in one company on January 3, 2000 turned to be worth by July 17, 2020.
This was a fun exercise. I used the site dividendchannel.com to calculate total stock returns. For other companies that were difficult to find, I looked at various databases available through my source, as well as old news/newspapers.
It is possible that an academic with access to a nice database may be able to get the results easier, and with less errors. I am limited by the fact that I am one person with one computer ( and a lazy intern).
My assumptions were that I would invest $10,000 in each of the 100 Nasdaq 100 companies on January 3, 2000. I would hold till July 17, 2020.
If a company is acquired, I just keep the dollars in cash. I did not assume any reinvestment, which would have likely further increased returns. That’s because most of these acquisitions occurred when stocks were cheaper five years ago. I also did not track how an exchange in the acquirers shares would have done. But my goal was to research how each individual company fared as an investment, and go from there. It very is likely that I am understating investor returns with this methodology. If you are able to quickly make calculations using historical databases at your disposal, your input would be much appreciated.
It turned out that if you equally weighted the 100 companies in Nasdaq 100 from 2000, you ended up quadrupling your investment.
If you drill down on the individual company level, you can see that only 50 companies delivered a profit to their shareholders. The other 50 delivered a loss to their shareholders.
Only 23 companies managed to at least triple the returns. Ten of these companies accounted for $2.65 million of the $3.1 million in gains - so basically for close to 90% of the gains. If you had sold these ten companies, but held on to the others, you would have barely broken even after 20 years.
A $1,000,000 investment on January 3, 2000 was spread over 100 companies, investing $10,000 in each. By July 17, 2020, that investment turned out to be worth $4.089 million. That's better than the $3.32 million if you had merely invested in the Nasdaq 100 Trust Etf (QQQ).
In other words, you did better than the Nasdaq 100 itself.
That’s because I assumed equal weighting, which gives each company the same opportunity to the top. The Nasdaq 100 is a market capitalization weighted, which means that the largest companies are given a higher weight. These large companies in 2000 were Cisco and Intel, both of which were overvalued and too large to grow as fast as their market prices in 2000 suggested. There were a lot of other large companies from 2000, which did not do that well – JDS Uniphase, Sun Microsystems etc.
Microsoft did pretty well, rising fivefold in value, most of the gains being in the last 6 – 7 years however.
The 10 largest companies accounted for over 43.60% of the index value. They didn't do as well, as an equally weighted $100,000 investment turned out to be worth $136,554 by 2020.

Most of the gains were driven by the companies that had a small allocation to the Nasdaq 100 in 2000. This goes contrary to the idea that you should concentrate your portfolio in your best ideas.
You can see that the ten best performing companies from Nasdaq 100 from January 2000 represented less than a 5% weighting in the index around the time of the dot-com bubble. Yet an investment of $100,000 that was allocated equally between these ten companies turned out to a cool $2.757 million by July 2020.

In fact, the best performing company in Nasdaq 100 from 2000 was Apple, which turned out to be a 100 bagger through July 2020. It had a 1% weighting in Nasdaq 100 in 2000.
Amazon was a 33 bagger, but it had a less than half a percent allocation in Nasdaq 100.
The other reason why it did so well is because there was not a lot of forced turnover. Usually, index committees actively take in and out stocks from an index. That activity reduces investment costs and returns. You may notice that the companies in the Nasdaq 100 that quadrupled your money were already public in 2000. You did not need to own companies that went public after 2000, which is somewhat counter-intuitive to many investors.
There are several lessons I learned from this study. I will discuss how they will impact my investing.
The first lesson is that we do not know in advance which the best performers over the next 10 or 20 years will be. That’s why it makes sense to diversify. The paretto principle in action works here – a small group of companies provide most of the investment returns, while the rest are losers. This means to avoid selling as much as possible. If you sold Apple or Amazon in 2000, you would have not achieved great returns. A lot of investors make the mistake of selling their winners early, because supposedly nobody went broke taking a profit. That’s bullshit. When you sell shares, you are taking a huge risk. If you sell early some of the companies that turn out to be the biggest winners in your portfolio, you are destined for a life of investment mediocrity. If you keep them, you may live to see another day and possibly make a profit. Let your winners run, and keep losses small.
The second lesson is that we need to be as patient as possible when investing. It may take us a long period of time to realize our investment gains. For example, a lot of companies in the index, and the index itself, spent a large portion of time in a drawdown (losing money). If you look at Microsoft (MSFT), you can see that up until 2013 an investment in 2000 was under water.
That’s why you need to keep your investment, and not sell. It is hard to do, especially if you are sitting at a loss for 10 – 15 years. Sometimes, good things take time to occur.
The third lesson is that future returns are unpredictable. A company may not go anywhere for a decade, leading many investors to sell. That’s usually how it goes, since when everyone bails out, the company starts succeeding. So you need to keep invested,
The fourth lesson is to give each company an equal chance of success. The ten largest companies in Nasdaq 100 in 2000 accounted for more than 40% of the index weight. Yet, they turned a $100,000 investment to $136,000 by 2020.
The fifth lesson is that valuation matters. The companies in 2000 were overvalued as a group. Perhaps the 10 or 20 largest companies were overvalued the most, dragging the valuation multiples upwards. But the high valuation made making future returns more difficult to accomplish. If all the future growth for the next 20 years is priced in today, you will likely make no returns. If it turns out that the 2000 investors were over optimistic, they you would suffer losses. Either way, as a group, it took the list of companies a decade go through the valuation compression, even if they did better fundamentally. Then it took another decade for the growth in fundamentals to lift investment returns too. It is also likely that valuation multiples are high today as well.
The reason why stocks went nowhere between 2000 – 2013 was mostly because they were so overvalued in 2000. If stocks had been cheaper in 2000, investors would have likely enjoyed a return in 2000-2010 and 2010- 2020. But in the stock market, returns are lumpy (unless you are focusing on dividends of course).
The sixth lesson is that passive investing works. To me, passive investing does not mean just buying an index fund. It means assembling a diversified portfolio of investments, limiting turnover and costs, and holding for the long with a limited interruption to the compounding process. Selling is costly, because you risk getting rid of one of the few companies that can lift your portfolio returns. Hence, holding on tight works, since the reduced turnover reduces commissions, fees and taxes, along with the aforementioned behavioral costs.
There are actually tax advantages to constructing a holding such a portfolio in a taxable account. Since a large portion of companies ended up losing money, the investor generated tax losses to offset income. These are worth something in a direct portfolio, and this is something that is no passed on to holders for ETFs or mutual funds.
The majority of companies that lost money ended up delisting due to failure or due to an acquisition. For the 45 companies where the investment value was less than 10,000 on 7/17/2020, and had an end date associated with a delisting, the ending value was $128,344. Yet, a cool $450,000 was invested in those enterprises. This leads to a long-term capital loss carryforward of $320,000. This can be used to offset future capital gains when realized, or to offset regular income.
We also had 17 companies that were delisted most probably due to an acquisition/merger, resulting in a profit. The net effect is $389,693 in value, which creates a long-term capital gain of close to $270,000. I know for a fact that Sigma-Aldrich (SIAL) was completed in cash in 2015, so a third of those long-term gains of $270,000 were not deferred by exchanging the acquirer stock for the acquired company stock.
Ok then, perhaps it is best to invest in a tax-deferred account then in order to minimize the headaches at tax time every year.
The seventh lesson is the importance of luck in investing. While valuation is important, it is only visible in hindsight, as valuation is part art, part science. Stocks may stay overvalued for an extended period of time. In fact, many believed that stocks were overvalued as early as 1992, and 1994 – 1995 and particularly in 1996 with Greenspan’s famous quote about “irrational exuberance”. Yet if you had bought stocks at that date, you would have done very well for yourself ( assuming you had the patience to hold on for 25 years without selling). If you managed to buy this list in 2010, you would have done very well, as valuations were much cheaper than in 2000. Since most returns occurred 10 years ago, this means that the investor buying in 2010 has the view that stocks only go up and they enjoyed all the gains that the 2000 investor had, but in half the time.
The first school of thought is that value and growth are connected at the dot. You have to pay a higher multiple for future growth.
Another school of thought believes that you need to wait and not overpay for future growth.
Sometimes, the investors who wait to buy at the right price, and avoid overpaying tend to look very smart. Like avoiding buying Japanese stocks in 1989 or Tech stocks in 2000.
Other times, buying stocks at any price seems to be a winning combination. Like buying tech stocks in 2010, or 1990 or buying Japanese stocks in 1980.
Many investors today believe that stocks are overvalued. Others believe that stocks are priced correctly for the environment we are in.
We have all heard that stocks return 10%/year. This is correct for the stock market as a whole. But when you dig through on the individual security level, you can find that a lot of companies tend to not do very well. Some research found that most companies tend to do worse than Treasury bills. The great stock market returns are driven by a handful of companies that tend to push the fortunes of investors upwards.
Depending on how you view the data however, you can see that the largest companies that are profitable, tend to continue delivering profits to shareholders. This is perhaps why investing in well known large blue chip companies that make money has worked so well, and is so popular with DIY investors. Focusing on smaller and less known companies is more speculative, and this is precisely where the majority of companies with terrible returns tend to hang out.
If you look at a list of companies at the beginning of a period, and trace the results 10 or 20 years down the road, you get to see a very interesting observation. Notably, the paretto principle in action.
The paretto principle for equities should state that 20% of companies are responsible for 80% of equity returns. This is why you need to have great diversification, but also focus on quality too. While we do not know which the best companies over the next 20 years are going to be, we know that we need to diversify, and hopefully our portfolio as a whole should do ok.
This is a very interesting exercise for me to go through as well, because it does tell me that predicting future winners and losers from a list is very difficult. I've tried it before, but my success could have been due to luck, than skill.
This exercise also teaches me that investing is part art, part science. It also teaches me that the overall results from a portfolio would be dependent on a few big winners. So if I sell those winners early, that would mean that I would be stuck with a mediocre investment career. If I hold on to those winners, I may look like a winner at the end. The goal is to build a diversified portfolio, and stick to my holdings. I encourage investors to read more about the Coffee Can Approach.
In general, a low P/E ratio signals "value" to many investors. However, if a company with a low P/E ratio never grows earnings or even worse, its profits decline over time and even turn to losses due to challenging business conditions, it may turn out to be a value trap.
On the other hand, companies with high P/E ratios may signal "danger" to many investors. However, a company with a high P/E ratio that manages to grow earnings per share over time may turn out to have been a cheaper stock than a low P/E one.
Of course, while P/E ratio and dividend yield are relatively known today, the future growth of earnings and the business are tough to ascertain with any certainty.
The funny part is that neither of these approaches works all the time. Things are cyclical in nature. Sometimes the so called value approach works great, and it washes out the growth investors.
After that, the growth cycle comes into gear, and these companies and investors tend to smoke out any value investors.
Both can work, but over long periods of time. Even if your approach works eventually, it may be a very long and testing process, where the majority of results re not visible until the end.
For example, investing in the Nifty 50 in 1972 delivered similar results to investing in S&P 500 through 1998. Source: Valuing Growth Stocks: Revisiting the Nifty Fifty

That's despite the fact that the Nifty 50 sold at ridiculously high P/E ratios. It turned out that as a whole, these companies were priced right as a group, since their earnings growth more than compensated for the high P/E ratios. Of course, long-term investors had a long and trying time in the market, since the first decade after 1972 brought poor results, as these companies went back to more reasonable valuation. The valuation compression ate into returns in the first decade, despite the fact that these businesses were still growing profits. Ultimately, the long-term returns of these businesses were dependent on the underlying fundamentals growth in these businesses. If someone became scared or lost patience after a decade of poor or no returns, they would have bought high and sold low.
The results of two different investors in the same Nifty 50 stocks would have varied significantly based on their start/end timeframe. Someone who started in 1972 would have had their conviction tested in the first decade, before recovering and ultimately recovering nicely. However, if someone started just a few years later, they would have done fantastically. I often think about results we see, if we did one thing at a certain time versus another. Since we as humans learn from experience, it is interesting to observe how early success or failure would affect our psyche as investors. If you fail early on, you may give up, even if that failure may have been a simple test of conviction ( albeit with a 70% drawdown in 2 years). If we experience winning from the start, we may see things differently.
Let's think about value versus growth with another example. Between 1950 and 2003, Exxon had a lower rate of growth and a lower P/E than IBM. However, Exxon did better for its investors than IBM. Mostly because the dividends were reinvested back into a low P/E, low valuation. The stock was not overvalued relative to its earnings prospects.
Recently, we have the Nasdaq 100 reaching all time highs, which has made some investors very confused. After all, we are in the midsts of a global pandemic that would have far-reaching repercussions for the world economy for years down the road. The US GDP has contracted by the highest amount in Q2 2020, and we have the same situation for a large part of the developed world. Unemployment is high, and there are riots on the streets.
Plenty of investors see that news, and assume a bearish view. This view is reinforced by high valuations for stocks. Many are comparing the high valuations today with the Nifty Fifty from 1972, and the Dot Com bubble from 1999 - 2000.
Prof Jeremy Siegel has already discussed how investing in the original Nifty Fifty has done for investors through 1998. I decided to go back and see how a passive investor in the Nasdaq 100 would have done if they bought in January 2000. If we are in a similar situation as in 2000, perhaps studying how it turned out, may give us some ideas on how to proceed today.
If you bought Nasdaq 100 in 2000, you would have basically tripled your money by July 2020. This is not a bad deal, given the fact that tech stocks were ridiculously expensive in 2000. With sky-high P/E ratios that made little sense, but fueled by the belief in unlimited future growth prospects. Of course, to get there, you had to endure a long and grueling period of about 13 - 14 years, before breaking even. This would have tested the nerves of many investors.
It was fascinating for me to dig a little further. I was able to find the components for Nasdaq 100 companies in 2000. You can view the companies in the list below. It has it sorted by portfolio weight.
The next step I took was to calculate the returns for each company from January 1, 2000 to July 17, 2020. This is shown in the third column above. The column shows how a $10,000 investment in one company on January 3, 2000 turned to be worth by July 17, 2020.
This was a fun exercise. I used the site dividendchannel.com to calculate total stock returns. For other companies that were difficult to find, I looked at various databases available through my source, as well as old news/newspapers.
It is possible that an academic with access to a nice database may be able to get the results easier, and with less errors. I am limited by the fact that I am one person with one computer ( and a lazy intern).
My assumptions were that I would invest $10,000 in each of the 100 Nasdaq 100 companies on January 3, 2000. I would hold till July 17, 2020.
If a company is acquired, I just keep the dollars in cash. I did not assume any reinvestment, which would have likely further increased returns. That’s because most of these acquisitions occurred when stocks were cheaper five years ago. I also did not track how an exchange in the acquirers shares would have done. But my goal was to research how each individual company fared as an investment, and go from there. It very is likely that I am understating investor returns with this methodology. If you are able to quickly make calculations using historical databases at your disposal, your input would be much appreciated.
It turned out that if you equally weighted the 100 companies in Nasdaq 100 from 2000, you ended up quadrupling your investment.
If you drill down on the individual company level, you can see that only 50 companies delivered a profit to their shareholders. The other 50 delivered a loss to their shareholders.
Only 23 companies managed to at least triple the returns. Ten of these companies accounted for $2.65 million of the $3.1 million in gains - so basically for close to 90% of the gains. If you had sold these ten companies, but held on to the others, you would have barely broken even after 20 years.
A $1,000,000 investment on January 3, 2000 was spread over 100 companies, investing $10,000 in each. By July 17, 2020, that investment turned out to be worth $4.089 million. That's better than the $3.32 million if you had merely invested in the Nasdaq 100 Trust Etf (QQQ).
In other words, you did better than the Nasdaq 100 itself.
That’s because I assumed equal weighting, which gives each company the same opportunity to the top. The Nasdaq 100 is a market capitalization weighted, which means that the largest companies are given a higher weight. These large companies in 2000 were Cisco and Intel, both of which were overvalued and too large to grow as fast as their market prices in 2000 suggested. There were a lot of other large companies from 2000, which did not do that well – JDS Uniphase, Sun Microsystems etc.
Microsoft did pretty well, rising fivefold in value, most of the gains being in the last 6 – 7 years however.
The 10 largest companies accounted for over 43.60% of the index value. They didn't do as well, as an equally weighted $100,000 investment turned out to be worth $136,554 by 2020.
Most of the gains were driven by the companies that had a small allocation to the Nasdaq 100 in 2000. This goes contrary to the idea that you should concentrate your portfolio in your best ideas.
You can see that the ten best performing companies from Nasdaq 100 from January 2000 represented less than a 5% weighting in the index around the time of the dot-com bubble. Yet an investment of $100,000 that was allocated equally between these ten companies turned out to a cool $2.757 million by July 2020.
In fact, the best performing company in Nasdaq 100 from 2000 was Apple, which turned out to be a 100 bagger through July 2020. It had a 1% weighting in Nasdaq 100 in 2000.
Amazon was a 33 bagger, but it had a less than half a percent allocation in Nasdaq 100.
The other reason why it did so well is because there was not a lot of forced turnover. Usually, index committees actively take in and out stocks from an index. That activity reduces investment costs and returns. You may notice that the companies in the Nasdaq 100 that quadrupled your money were already public in 2000. You did not need to own companies that went public after 2000, which is somewhat counter-intuitive to many investors.
There are several lessons I learned from this study. I will discuss how they will impact my investing.
The first lesson is that we do not know in advance which the best performers over the next 10 or 20 years will be. That’s why it makes sense to diversify. The paretto principle in action works here – a small group of companies provide most of the investment returns, while the rest are losers. This means to avoid selling as much as possible. If you sold Apple or Amazon in 2000, you would have not achieved great returns. A lot of investors make the mistake of selling their winners early, because supposedly nobody went broke taking a profit. That’s bullshit. When you sell shares, you are taking a huge risk. If you sell early some of the companies that turn out to be the biggest winners in your portfolio, you are destined for a life of investment mediocrity. If you keep them, you may live to see another day and possibly make a profit. Let your winners run, and keep losses small.
The second lesson is that we need to be as patient as possible when investing. It may take us a long period of time to realize our investment gains. For example, a lot of companies in the index, and the index itself, spent a large portion of time in a drawdown (losing money). If you look at Microsoft (MSFT), you can see that up until 2013 an investment in 2000 was under water.
That’s why you need to keep your investment, and not sell. It is hard to do, especially if you are sitting at a loss for 10 – 15 years. Sometimes, good things take time to occur.
The third lesson is that future returns are unpredictable. A company may not go anywhere for a decade, leading many investors to sell. That’s usually how it goes, since when everyone bails out, the company starts succeeding. So you need to keep invested,
The fourth lesson is to give each company an equal chance of success. The ten largest companies in Nasdaq 100 in 2000 accounted for more than 40% of the index weight. Yet, they turned a $100,000 investment to $136,000 by 2020.
The fifth lesson is that valuation matters. The companies in 2000 were overvalued as a group. Perhaps the 10 or 20 largest companies were overvalued the most, dragging the valuation multiples upwards. But the high valuation made making future returns more difficult to accomplish. If all the future growth for the next 20 years is priced in today, you will likely make no returns. If it turns out that the 2000 investors were over optimistic, they you would suffer losses. Either way, as a group, it took the list of companies a decade go through the valuation compression, even if they did better fundamentally. Then it took another decade for the growth in fundamentals to lift investment returns too. It is also likely that valuation multiples are high today as well.
The reason why stocks went nowhere between 2000 – 2013 was mostly because they were so overvalued in 2000. If stocks had been cheaper in 2000, investors would have likely enjoyed a return in 2000-2010 and 2010- 2020. But in the stock market, returns are lumpy (unless you are focusing on dividends of course).
The sixth lesson is that passive investing works. To me, passive investing does not mean just buying an index fund. It means assembling a diversified portfolio of investments, limiting turnover and costs, and holding for the long with a limited interruption to the compounding process. Selling is costly, because you risk getting rid of one of the few companies that can lift your portfolio returns. Hence, holding on tight works, since the reduced turnover reduces commissions, fees and taxes, along with the aforementioned behavioral costs.
There are actually tax advantages to constructing a holding such a portfolio in a taxable account. Since a large portion of companies ended up losing money, the investor generated tax losses to offset income. These are worth something in a direct portfolio, and this is something that is no passed on to holders for ETFs or mutual funds.
The majority of companies that lost money ended up delisting due to failure or due to an acquisition. For the 45 companies where the investment value was less than 10,000 on 7/17/2020, and had an end date associated with a delisting, the ending value was $128,344. Yet, a cool $450,000 was invested in those enterprises. This leads to a long-term capital loss carryforward of $320,000. This can be used to offset future capital gains when realized, or to offset regular income.
We also had 17 companies that were delisted most probably due to an acquisition/merger, resulting in a profit. The net effect is $389,693 in value, which creates a long-term capital gain of close to $270,000. I know for a fact that Sigma-Aldrich (SIAL) was completed in cash in 2015, so a third of those long-term gains of $270,000 were not deferred by exchanging the acquirer stock for the acquired company stock.
Ok then, perhaps it is best to invest in a tax-deferred account then in order to minimize the headaches at tax time every year.
The seventh lesson is the importance of luck in investing. While valuation is important, it is only visible in hindsight, as valuation is part art, part science. Stocks may stay overvalued for an extended period of time. In fact, many believed that stocks were overvalued as early as 1992, and 1994 – 1995 and particularly in 1996 with Greenspan’s famous quote about “irrational exuberance”. Yet if you had bought stocks at that date, you would have done very well for yourself ( assuming you had the patience to hold on for 25 years without selling). If you managed to buy this list in 2010, you would have done very well, as valuations were much cheaper than in 2000. Since most returns occurred 10 years ago, this means that the investor buying in 2010 has the view that stocks only go up and they enjoyed all the gains that the 2000 investor had, but in half the time.
Wednesday, August 12, 2020
Investing Beliefs, Weakly Held
I wanted to touch base with you, and see if I can learn from your experiences.
I recently asked folks on Twitter the following question:
"What is something you used to believe about investing, but do not believe anymore?"

I received some interesting responses. You can check some of them here.
I also reached out to readers in my investing newsletter, and they offered some great ideas as well.
I wanted to reach out to you and see if you would be willing to share any investing beliefs you had, which you no longer have. If you are willing to do so, I would also appreciate hearing more about the reasoning behind the decision.
You can feel free to post your comment below.
I will likely use those in an article that may appear some time in the future. Obviously, your names/profile names would not be used.
Thank you for reading!
I recently asked folks on Twitter the following question:
"What is something you used to believe about investing, but do not believe anymore?"
I received some interesting responses. You can check some of them here.
I also reached out to readers in my investing newsletter, and they offered some great ideas as well.
I wanted to reach out to you and see if you would be willing to share any investing beliefs you had, which you no longer have. If you are willing to do so, I would also appreciate hearing more about the reasoning behind the decision.
You can feel free to post your comment below.
I will likely use those in an article that may appear some time in the future. Obviously, your names/profile names would not be used.
Thank you for reading!
Monday, August 10, 2020
Six Companies Demonstrating A Commitment to Shareholder Returns
My portfolio monitoring process can be best summarized by these two major activities:
1) I screen the dividend growth investing universe, using a few parameters for entry.
2) I look at major announcements, such as earnings releases and dividend increases or cuts
The second process revolves around reviewing press releases for earnings and dividend announcements for the past week. I usually focus my attention on companies that have increased dividends for at least a decade. My analysis has discovered that companies that get to grow dividends for a decade are more likely to continue raising them.
A long history of annual dividend increases is an indication of a strong business that generates more in excess cashflows each year. I am interested in companies whose business model can generate excess cashflows for long periods of time after my investments. My requirement to look for a ten year history of annual dividend increases eliminates a lot of companies who simply got lucky in the right place of the cycle. This requirement also reduces the number of cyclical companies, which generally have poor long-term dividend growth prospects.
I review the trends in earnings per share, dividend payout ratios and growth in dividends, in order to determine the likelihood of further dividend growth in the future. I look at the interplay between all factors, rather than focus on one item over the others. No two companies are the same.
Last but not least, I also look at valuation. Valuation is part art, part science. In general, companies with low multiples tend to have slow growth, while companies with high multiples have higher expected growth. Finding the right balance between these two, coupled with the trade-off between dividend yield and dividend growth, is the secret sauce.
Now that I have spilled all my secrets with you, I wanted to share the companies that raised dividends over the past week. Just as I discussed above, I focused on the companies that have raised dividends for at least a decade, and have also managed to boost dividends last week. The companies include:
Dover Corporation (DOV) provides equipment and components, consumable supplies, aftermarket parts, software and digital solutions, and support services worldwide.
The company increased its quarterly dividend by 1% to 49.50 cents/share. This was the 65th consecutive year in which the Company has increased its annual cash dividend, demonstrating Dovers long standing commitment to returning capital to shareholders. Over the past decade, this dividend king has managed to increase distributions at an annualized rate of 8.60%.
The company earned $3.12/share in 2008, $1.91/share in 2009 and managed to grow profits to $4.61/share in 2019. The company is expected to earn $5.20/share in 2020.
The stock is selling for 20.80 times forward earnings and offers a dividend yield of 1.85%.
Essential Utilities, Inc., (WTRG) operates regulated utilities that provide water or wastewater services in the United States. It offers water services through operating and maintenance contracts with municipal authorities and other parties.
The company increased its quarterly dividend by 7% to 25.10 cents/share. This marked the 28th consecutive year of annual dividend increases for this dividend champion.
Over the past decade, this dividend champion has managed to grow dividends at an annualized rate of 7.50%/year.
Between 2009 and 2019, the company grew earnings from $0.62/share to $1.04/share.
The company is expected to generate $1.48/share in 2020.
The stock is not cheap at 31.90 times forward earnings. It does offer a low yield for a utility of 2.10%, but that is the price to pay for future growth.
STERIS plc (STE) provides infection prevention and other procedural products and services worldwide. It operates in four segments: Healthcare Products, Healthcare Specialty Services, Life Sciences, and Applied Sterilization Technologies.
The company raised its quarterly dividend by 8.10% to 40 cents/share. This marked the 16th year of annual dividend increases for Steris. Over the past decade, this dividend achiever has managed to boost distributions at an annualized rate of 13.20%.
Steris managed to grow earnings from $2.16/share in 2010 to $4.76/share in 2020.
The company is expected to generate $5.49/share in 2021.
The stock is not cheap at 28.10 times forward earnings. It yields 1.05%.
Microchip Technology Incorporated (MCHP) develops, manufactures, and sells semiconductor products for various embedded control applications in the Americas, Europe, and Asia.
The company raised its quarterly dividend by 0.15% to 0.368 cents/share. Microchip Technology has been increasing dividends by a trickle every quarter for some time now, but has a 19 year track record of consecutive annual dividend increases. During the past decade, this dividend achiever managed to boost dividends at an annualized rate of 0.75%.
Between 2010 and 2020, the company grew earnings from $1.16/share to $2.23/share.
The company is expected to generate $5.86/share in 2021.
The stock looks optically cheap at 16.90 times forward earnings, but yields only 1.50% with a slow rate of growth.
Illinois Tool Works Inc. (ITW) manufactures and sells industrial products and equipment worldwide. It operates through seven segments: Automotive OEM; Food Equipment; Test & Measurement and Electronics; Welding; Polymers & Fluids; Construction Products; and Specialty Products.
Illinois Tool Works raised its quarterly dividend by 6.50% to $1.14/share. This marked the 46th consecutive annual dividend increase for this dividend champion.
The company managed to grow earnings from $1.89/share in 2009 to $7.74/share in 2019.
The company is expected to generate $5.76/share in 2020.
The stock is not cheap at 33.10 times forward earnings. It offers a dividend yield of 2.40%.
Badger Meter, Inc. (BMI) manufactures and markets flow measurement, control, and communication solutions in the United States, Asia, Canada, Europe, Mexico, the Middle East, and internationally. It offers mechanical or static water meters, and related radio and software technologies and services to municipal water utilities.
The company increased its quarterly dividend by 5.90% to 18 cents/share. This marked the 28th consecutive annual dividend increase for this dividend champion. Over the past decade, this dividend champion has managed to boost distributions at an annualized rate of 10.80%.
Between 2009 and 2019, the company managed to grow earnings from $1.14/share to $1.61/share.
Badger Meter is expected to generate $1.49/share in 2020.
The stock is expensive at 45.30 times forward earnings. Badger Meter yields close to 1.10%.
Relevant Articles:
- Nine Dividend Paying Companies Raising Dividends Last Week
- Two Sweet Dividend Increases For Long-Term Shareholders
- Five Dividend Growth Stocks Rewarding Shareholders With Raises
- Two Cheap Dividend Stocks Raising Dividends Last Week
Thursday, August 6, 2020
Warren Buffett: America's Youngest Early Retiree
In 1954, Warren Buffett got a job at Graham-Newman, which was a value investing company with an impressive track record. The company was managed by Benjamin Graham, the author of Security Analysis and The Intelligent Investor. Benjamin Graham is said to be the father of value investing, and one of the original security analysts to put security analysis on the maps. His annual salary was $12,000.
Buffett had sold securities prior to that, managed his own portfolio and participated in numerous business ventures, including placing pinball machines in barber shops. Between 1950 and 1955, his net worth increased from $9,800 to $127,000.
This was his dream job. Buffett had been rejected by Harvard, and went to school in Columbia, where Ben Graham taught a course on value investing. Buffett wanted to go work for Graham after graduating. He even offered to work for free, but Graham rejected him at the time as “overvalued”.
After selling securities for his father’s firm between 1951 and 1954, Buffett received an offer from Ben Graham, which he accepted on the spot. This was his dream job to work for his mentor.
In 1955, Buffett learned that Ben Graham was going to retire and close his investing company.
Warren declined the opportunity to become a partner in Graham-Newman. Instead, he chose to retire. He shares this story in this great article.
He was 25 at the time, married with a kid. However, he was not worried at all. These are his words, as discussed in a Forbes article from a few years ago:
The thing is, when I got out of college, I had $9,800, but by the end of 1955, I was up to $127,000. I thought, I’ll go back to Omaha, take some college classes, and read a lot—I was going to retire! I figured we could live on $12,000 a year, and off my $127,000 asset base, I could easily make that. I told my wife, “Compound interest guarantees I’m going to get rich.”
Warren Buffett decided to become a private investor in 1955, and live off his capital base. He retired at the age of 25. He expected that his investment skill would be sufficient to generate as much money as his old day job at Graham-Newman.
Retiring early to pursue your passions is a concept that many Financial Independence Retire Early (FIRE) Blogs focus on. Living on your capital, rather than employment is the goal for many of these folks. We do get inspired by folks like Mr Money Mustache who retired at the age of 30 after a decade of investing or Derek Foster, who retired at the age of 34.
Here we have Warren Buffett, who retired at the age of 25 however. He retired to live life on his own terms, and do what made him excited to get out of bed every morning and "tap dance to "work"". Similar to every early retiree, he focused his attention on pursuing his passions and focus on what's important for him in life. And he succeeded beyond his wildest dreams most probably.
To put things in perspective, the average salary for a full-time employee in the 1950s was roughly $5,500/year. So Buffett was earning above average income, and he was expecting to earn an above average income from his investing.
It looks like he expected to generate 10%/year and live off these proceeds. That’s a pretty high annual return needed, but this is the Oracle of Omaha we are talking about. He has been able to compound money at Berkshire Hathaway and the Berkshire Partnerships at 20%/year for decades. Which means that even if he remained a private investor, he would have likely continued to compound his money at more than 10%/year, even after paying for his living expenses.
The most fascinating thought process for me is that if he had managed to compound his capital, net of living and investment expenses, at 10%/year between 1955 and 2019, he would have a net worth of $56.6 million today. That would have been an impressive track record, and he would have been wealthier than most investors today. But it is very likely that we would have never heard about him. It is very likely that if he really retired to do his own thing in the 1950s, there wouldn’t have been several books about him, the annual shareholder meetings, and the fame.
In 1955, it would have been quite easy to construct a portfolio of blue-chip companies that yielded 5%. Security prices had just exceeded their pre-Depression highs from 1929, even as earnings and dividend payments had increased substantially.
His lifestyle does not seem very frugal however. Each dollar in 1955 has the same purchasing power as $9.60 in 2019. In other words, an item that used to cost $1 in 1955 can be purchased at $9.60 today. This means that spending $12,000/year was equivalent to spending $115,200/year today. That’s a pretty nice lifestyle to have in Omaha, Nebraska.
For reference, his net worth was quite impressive for a 25-year-old, since his $127,000 in 1955 is equivalent to having $1.20 million today.
It is fascinating to read his opinion on housing from that time.
In Omaha, I rented a house at 5202 Underwood for $175 a month. I told my wife, “I’d be glad to buy a house, but that’s like a carpenter selling his toolkit.” I didn’t want to use up my capital.
However, three years later he did buy a house for a reported $31,500 in 1958. Although I do not know his networth in 1958, I do know that he became a millionaire in 1960, at the tender age of 30.
The nice thing is that he was able to focus his attention to investing full time. The really nice thing is that he had wealthy relatives and friends, who put up money to start his investment partnership in 1956. Later on, money came pouring in through word of mouth. Several of Graham-Newman’s clients invested with Warren Buffett. You can read more about the Buffett Partnership and read his 1956 - 1969 letters here.
He managed to compound that money at high rates of return, beating his benchmarks in the process. As a result, the assets under management for the Buffett partnership compounded to $100 million by 1969. Warren Buffett was worth $20 million by 1969.
This is when he decided to retire for a second time. This time he retired at the age of 39. By 1970, his sole occupation was being a CEO of Berkshire Hathaway.
If he had really just managed to earn 10%/year off that $20 million by retiring and focusing on charity work for example, Buffett would have been worth roughly $2.3 billion. It would still be very impressive, but nowhere close to being one of the ten richest people in the world. Very few would even bother studying his investment record. Just as few are studying the investment records of other investors on the Forbes list worth less than $10 billion today.
It is fascinating that Buffett retired at the age of 25, and decided to live off investment income. He has been fascinated with the power of compound interest since he read the book “1000 ways to earn $1000” as an impressionable teenager. He knew that even a modest rate of return, compounded over long periods of time could lead to impressive results. For example, a dollar you waste in your 20s, could have grown to $117 in 50 years, provided that you invested it at a 10% annualized total return.
While you may not be alive in 50 years, there is a very high chance that a family member or a charitable cause could be there in 50 years, and benefiting from your foresight.
It is also fascinating to think about opportunity costs. If Buffett had decided to just work an ordinary job, and not focus on investments full time, he would still end up rich but not rich enough to have biographies written about him, and world leaders reaching out to him on the phone in times of crisis. He retired twice, at the ages of 25 and 39. However, he retired to do something better than before.
It is even more fascinating to look at mistakes made, opportunities missed and calculate their impact, decades down the road. Doing so really makes you understand how a simple decision can have a type of butterfly effect that reverberates over the decades.
For example, back in 1951, Buffett lost 20% of his networth on a Sinclair station that he tried to manage. That was approximately $2,000, as he was worth $10,000 at the time. In a 1998 speech he mentioned that the opportunity cost of those $2,000 was something like $6 billion. It is triple that amount now.
I am pretty sure that he would have been wealthier if he had not bought his house in 1958. But at some point, you need to use the money to create the sort of life you need, not be a slave to the power of compounding either.
He made a smart decision at the age of 25 to retire early, and create a life that is true to his values. The money was merely a scorecard, a byproduct of his passion for investing. Investing is something he did when he was a teenager worth a few hundred dollars and it is something he still does, by managing a corporation worth hundreds of billions of dollars.
"Although I had no idea, age 25 was a turning point. I was changing my life, setting up something that would turn into a fairly good-size partnership called Berkshire Hathaway. I wasn’t scared. I was doing something I liked, and I’m still doing it."
You can see his networth by age in the chart below:
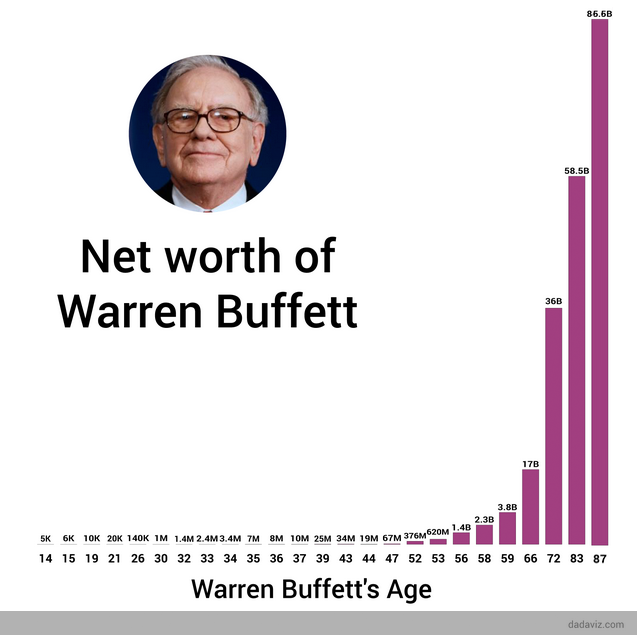
Relevant Articles:
- Buffett Partnership Letters
- The one lesson about Warren Buffett's success that no one wants to hear
- What would happen to Berkshire Hathaway after Warren Buffett is gone?
- The Pareto Principle In Dividend Investing
- Warren Buffett Investing Resource Page
- Warren Buffett’s Dividend Stock Strategy
Buffett had sold securities prior to that, managed his own portfolio and participated in numerous business ventures, including placing pinball machines in barber shops. Between 1950 and 1955, his net worth increased from $9,800 to $127,000.
This was his dream job. Buffett had been rejected by Harvard, and went to school in Columbia, where Ben Graham taught a course on value investing. Buffett wanted to go work for Graham after graduating. He even offered to work for free, but Graham rejected him at the time as “overvalued”.
After selling securities for his father’s firm between 1951 and 1954, Buffett received an offer from Ben Graham, which he accepted on the spot. This was his dream job to work for his mentor.
In 1955, Buffett learned that Ben Graham was going to retire and close his investing company.
Warren declined the opportunity to become a partner in Graham-Newman. Instead, he chose to retire. He shares this story in this great article.
He was 25 at the time, married with a kid. However, he was not worried at all. These are his words, as discussed in a Forbes article from a few years ago:
The thing is, when I got out of college, I had $9,800, but by the end of 1955, I was up to $127,000. I thought, I’ll go back to Omaha, take some college classes, and read a lot—I was going to retire! I figured we could live on $12,000 a year, and off my $127,000 asset base, I could easily make that. I told my wife, “Compound interest guarantees I’m going to get rich.”
Warren Buffett decided to become a private investor in 1955, and live off his capital base. He retired at the age of 25. He expected that his investment skill would be sufficient to generate as much money as his old day job at Graham-Newman.
Retiring early to pursue your passions is a concept that many Financial Independence Retire Early (FIRE) Blogs focus on. Living on your capital, rather than employment is the goal for many of these folks. We do get inspired by folks like Mr Money Mustache who retired at the age of 30 after a decade of investing or Derek Foster, who retired at the age of 34.
Here we have Warren Buffett, who retired at the age of 25 however. He retired to live life on his own terms, and do what made him excited to get out of bed every morning and "tap dance to "work"". Similar to every early retiree, he focused his attention on pursuing his passions and focus on what's important for him in life. And he succeeded beyond his wildest dreams most probably.
To put things in perspective, the average salary for a full-time employee in the 1950s was roughly $5,500/year. So Buffett was earning above average income, and he was expecting to earn an above average income from his investing.
It looks like he expected to generate 10%/year and live off these proceeds. That’s a pretty high annual return needed, but this is the Oracle of Omaha we are talking about. He has been able to compound money at Berkshire Hathaway and the Berkshire Partnerships at 20%/year for decades. Which means that even if he remained a private investor, he would have likely continued to compound his money at more than 10%/year, even after paying for his living expenses.
The most fascinating thought process for me is that if he had managed to compound his capital, net of living and investment expenses, at 10%/year between 1955 and 2019, he would have a net worth of $56.6 million today. That would have been an impressive track record, and he would have been wealthier than most investors today. But it is very likely that we would have never heard about him. It is very likely that if he really retired to do his own thing in the 1950s, there wouldn’t have been several books about him, the annual shareholder meetings, and the fame.
In 1955, it would have been quite easy to construct a portfolio of blue-chip companies that yielded 5%. Security prices had just exceeded their pre-Depression highs from 1929, even as earnings and dividend payments had increased substantially.
His lifestyle does not seem very frugal however. Each dollar in 1955 has the same purchasing power as $9.60 in 2019. In other words, an item that used to cost $1 in 1955 can be purchased at $9.60 today. This means that spending $12,000/year was equivalent to spending $115,200/year today. That’s a pretty nice lifestyle to have in Omaha, Nebraska.
For reference, his net worth was quite impressive for a 25-year-old, since his $127,000 in 1955 is equivalent to having $1.20 million today.
It is fascinating to read his opinion on housing from that time.
In Omaha, I rented a house at 5202 Underwood for $175 a month. I told my wife, “I’d be glad to buy a house, but that’s like a carpenter selling his toolkit.” I didn’t want to use up my capital.
However, three years later he did buy a house for a reported $31,500 in 1958. Although I do not know his networth in 1958, I do know that he became a millionaire in 1960, at the tender age of 30.
The nice thing is that he was able to focus his attention to investing full time. The really nice thing is that he had wealthy relatives and friends, who put up money to start his investment partnership in 1956. Later on, money came pouring in through word of mouth. Several of Graham-Newman’s clients invested with Warren Buffett. You can read more about the Buffett Partnership and read his 1956 - 1969 letters here.
He managed to compound that money at high rates of return, beating his benchmarks in the process. As a result, the assets under management for the Buffett partnership compounded to $100 million by 1969. Warren Buffett was worth $20 million by 1969.
This is when he decided to retire for a second time. This time he retired at the age of 39. By 1970, his sole occupation was being a CEO of Berkshire Hathaway.
If he had really just managed to earn 10%/year off that $20 million by retiring and focusing on charity work for example, Buffett would have been worth roughly $2.3 billion. It would still be very impressive, but nowhere close to being one of the ten richest people in the world. Very few would even bother studying his investment record. Just as few are studying the investment records of other investors on the Forbes list worth less than $10 billion today.
It is fascinating that Buffett retired at the age of 25, and decided to live off investment income. He has been fascinated with the power of compound interest since he read the book “1000 ways to earn $1000” as an impressionable teenager. He knew that even a modest rate of return, compounded over long periods of time could lead to impressive results. For example, a dollar you waste in your 20s, could have grown to $117 in 50 years, provided that you invested it at a 10% annualized total return.
While you may not be alive in 50 years, there is a very high chance that a family member or a charitable cause could be there in 50 years, and benefiting from your foresight.
It is also fascinating to think about opportunity costs. If Buffett had decided to just work an ordinary job, and not focus on investments full time, he would still end up rich but not rich enough to have biographies written about him, and world leaders reaching out to him on the phone in times of crisis. He retired twice, at the ages of 25 and 39. However, he retired to do something better than before.
It is even more fascinating to look at mistakes made, opportunities missed and calculate their impact, decades down the road. Doing so really makes you understand how a simple decision can have a type of butterfly effect that reverberates over the decades.
For example, back in 1951, Buffett lost 20% of his networth on a Sinclair station that he tried to manage. That was approximately $2,000, as he was worth $10,000 at the time. In a 1998 speech he mentioned that the opportunity cost of those $2,000 was something like $6 billion. It is triple that amount now.
I am pretty sure that he would have been wealthier if he had not bought his house in 1958. But at some point, you need to use the money to create the sort of life you need, not be a slave to the power of compounding either.
He made a smart decision at the age of 25 to retire early, and create a life that is true to his values. The money was merely a scorecard, a byproduct of his passion for investing. Investing is something he did when he was a teenager worth a few hundred dollars and it is something he still does, by managing a corporation worth hundreds of billions of dollars.
"Although I had no idea, age 25 was a turning point. I was changing my life, setting up something that would turn into a fairly good-size partnership called Berkshire Hathaway. I wasn’t scared. I was doing something I liked, and I’m still doing it."
You can see his networth by age in the chart below:
Relevant Articles:
- Buffett Partnership Letters
- The one lesson about Warren Buffett's success that no one wants to hear
- What would happen to Berkshire Hathaway after Warren Buffett is gone?
- The Pareto Principle In Dividend Investing
- Warren Buffett Investing Resource Page
- Warren Buffett’s Dividend Stock Strategy
Subscribe to:
Posts (Atom)