Sunday, January 29, 2023

29 Companies Rewarding Shareholders With Raises

As part of my monitoring process, I review the list of dividend increases every single week. This process helps me to identify patterns, and find out more about companies that regularly raise dividends. That's helpful information if you want to review existing holdings and identify companies for review early in their journey.

Last week was very busy for dividend increases. There were 64 companies that increased dividends last week. I reviewed the list, and narrowed it down to the companies that managed to increase dividends for at least a decade.

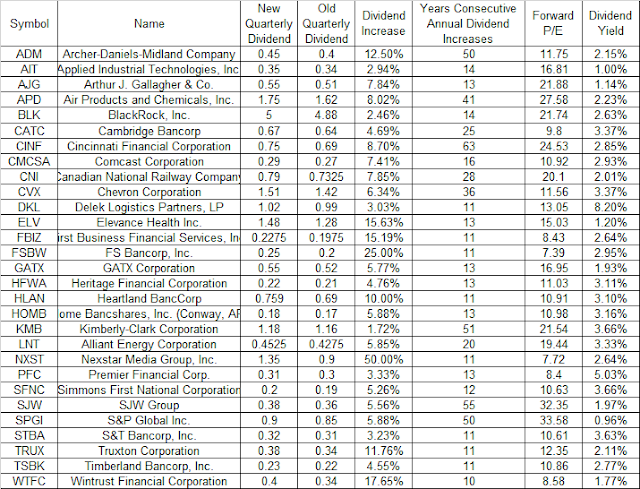
You can view the full list of 29 companies that met the criteria below: 


This is a list of companies for further review. Most seem attractive as businesses, but that doesn’t mean that they should be invested in at any price, regardless of valuation.

The next step is to check each business, in order to determine if it is worth further review. I would look at ten year trends in earnings per share, dividends per share, payout ratios, shares outstanding. I would try to understand what the business does, and make an assessment if the good times would continue, so that I can expect higher earnings, dividends and intrinsic values over time. I would look at the valuation relative to earnings and dividend growth, in order to determine if the business is fairly valued, if it looks promising too. 

Companies listed in this post include: ADM, AIT, AJG, APD, BLK, CATC, CINF, CMCSA, CNI, CVX, DKL, ELV, FBIZ, FSBW, GATX, HFWA, HLAN, HOMB, KMB, LNT, NXST, PFC, SFNC, SJW, SPGI, STBA, TRUX, TSBK, WTFC,


Relevant Articles:


Tuesday, January 24, 2023

Dividend Aristocrats List for 2023

 The S&P Dividend Aristocrats index tracks companies in the S&P 500 that have increased dividends every year for at least 25 years in a row. The index is equally weighted, and rebalanced every quarter.


To qualify for membership in the S&P 500 Dividend Aristocrats index, a stock must satisfy the following criteria:

1. Be a member of the S&P 500
2. Have increased dividends every year for at least 25 consecutive years
3. Meet minimum float-adjusted market capitalization and liquidity requirements defined in the index inclusion and index exclusion rules below.

The group of companies in the Dividend Aristocrats index tend to generate reliable dividend income, and provide the potential for strong total returns. The list is well diversified across sectors.

There are a record 67 companies in the Dividend Aristocrats index for 2023.

For 2023, there were several changes. The index added:

- C.H. Robinson Worldwide (CHRW)
- J.M. Smucker (SJM)
- Nordson Corp (NDSN)

The index removed no companies.

One company left the index in 2022 - People's United Financial (PBCT), because it was acquired by M&T Bank.

Since the inception of the index in 1989, the number of holdings has fluctuated from 26 to 67 holdings. This year marks the highest number of dividend aristocrats ever, on record. It is still not even half the number of Dividend Champions however.


The 2023 Dividend Aristocrats are listed below:

Symbol

Name

Sector

Years of Annual Dividend Increases

10 year Dividend   Growth

Dividend Yield

ABBV

AbbVie Inc.

Health Care

50

13.90%

3.66%

ABT

Abbott Laboratories

Health Care

50

6.90%

1.86%

ADM

Archer-Daniels-Midland Co

Consumer Staples

47

8.62%

1.72%

ADP

Automatic Data Processing

Information Technology

47

11.66%

2.09%

AFL

AFLAC Inc

Financials

41

9.09%

2.34%

ALB

Albemarle Corp.

Materials

28

7.35%

0.73%

AMCR

Amcor

Materials

27

#N/A

4.08%

AOS

Smith A.O. Corp

Industrials

29

20.27%

2.10%

APD

Air Products & Chemicals Inc

Materials

40

9.79%

2.10%

ATO

Atmos Energy

Utilities

39

7.22%

2.64%

BDX

Becton Dickinson & Co

Health Care

51

6.67%

1.43%

BEN

Franklin Resources Inc

Financials

43

12.21%

4.55%

BF.B

Brown-Forman Corp B

Consumer Staples

38

7.00%

#N/A

BRO

Brown & Brown

Financials

29

9.37%

0.81%

CAH

Cardinal Health Inc

Health Care

26

8.11%

2.58%

CAT

Caterpillar Inc

Industrials

29

8.95%

2.00%

CB

Chubb Ltd

Financials

29

5.44%

1.50%

CHD

Church & Dwight

Consumer Staples

26

8.14%

1.30%

CHRW

C.H. Robinson Worldwide

Industrials

25

5.08%

2.66%

CINF

Cincinnati Financial Corp

Financials

62

5.27%

2.70%

CL

Colgate-Palmolive Co

Consumer Staples

59

4.31%

2.39%

CLX

Clorox Co

Consumer Staples

45

6.56%

3.36%

CTAS

Cintas Corp

Industrials

40

20.70%

1.02%

CVX

Chevron Corp

Energy

35

4.93%

3.16%

DOV

Dover Corp

Industrials

67

6.11%

1.49%

ECL

Ecolab Inc

Materials

31

9.81%

1.46%

ED

Consolidated Edison Inc

Utilities

48

2.70%

3.32%

EMR

Emerson Electric Co

Industrials

66

2.52%

2.17%

ESS

Essex Property Trust

Real Estate

28

7.19%

4.15%

EXPD

Expeditors International

Industrials

28

9.12%

1.29%

FRT

Federal Realty Invt Trust

Real Estate

55

4.36%

4.28%

GD

General Dynamics

Industrials

31

9.53%

2.03%

GPC

Genuine Parts Co

Consumer Discretionary

66

6.11%

2.06%

GWW

Grainger W.W. Inc

Industrials

51

8.28%

1.24%

HRL

Hormel Foods Corp

Consumer Staples

57

13.24%

2.41%

IBM

Intl Business Machines

Information Technology

27

7.16%

4.68%

ITW

Illinois Tool Works Inc

Industrials

48

13.03%

2.38%

JNJ

Johnson & Johnson

Health Care

60

6.37%

2.56%

KMB

Kimberly-Clark

Consumer Staples

50

5.14%

3.42%

KO

Coca-Cola Co

Consumer Staples

60

5.61%

2.77%

LIN

Linde plc

Materials

29

7.84%

1.43%

LOW

Lowe's Cos Inc

Consumer Discretionary

60

19.95%

2.11%

MCD

McDonald's Corp

Consumer Discretionary

47

7.03%

2.31%

MDT

Medtronic plc

Health Care

45

10.00%

3.50%

MKC

McCormick & Co

Consumer Staples

36

9.09%

1.88%

MMM

3M Co

Industrials

64

9.71%

4.97%

NEE

NextEra Energy

Utilities

28

10.98%

2.03%

NDSN

Nordson Corp

Industrials

59

15.30%

1.09%

NUE

Nucor Corp

Materials

50

3.20%

1.55%

O

Realty Income Corp.

Real Estate

30

5.29%

4.70%

PEP

PepsiCo Inc

Consumer Staples

50

7.77%

2.55%

PG

Procter & Gamble

Consumer Staples

66

5.02%

2.41%

PNR

Pentair PLC

Industrials

47

3.58%

1.96%

PPG

PPG Industries Inc

Materials

51

7.54%

1.97%

ROP

Roper Technologies, Inc

Industrials

30

16.25%

0.63%

SHW

Sherwin-Williams Co

Materials

44

16.53%

1.01%

SJM

J.M. Smucker

Consumer Staples

25

7.23%

2.57%

SPGI

S&P Global

Financials

49

12.53%

1.02%

SWK

Stanley Black & Decker

Industrials

55

5.86%

4.26%

SYY

Sysco Corp

Consumer Staples

52

5.92%

2.56%

TGT

Target Corp

Consumer Discretionary

55

11.61%

2.90%

TROW

T Rowe Price Group Inc

Financials

36

13.44%

4.40%

VFC

VF Corp

Consumer Discretionary

50

10.92%

7.39%

WBA

Walgreens Boots Alliance Inc

Consumer Staples

47

6.71%

5.14%

WMT

Wal-Mart

Consumer Staples

49

3.65%

1.58%

WST

West Pharmaceutical Services

Health Care

30

7.18%

0.32%

XOM

Exxon Mobil Corp

Energy

40

5.00%

3.30%


Note: Data as of 12/31/2022


The index has generated strong total returns over time past decade. I wanted to note that in 2008, the Dividend Aristocrats index declined by 21.88%. The S&P 500 however declined by 37%.

The dividend aristocrats index tends to shine during bear markets and low return environments. However, it also pulls its weight when we are in a bull market too. It is the best of both worlds really.

These are the returns since the launch of the Dividend Aristocrats Index in 1989:

Year

Dividend  Aristocrats  

S&P 500

Difference

1990

5.70%

-3.10%

8.80%

1991

38.50%

30.50%

8.00%

1992

10.10%

7.60%

2.50%

1993

4.30%

10.10%

-5.80%

1994

0.90%

1.40%

-0.50%

1995

34.60%

37.60%

-3.00%

1996

20.90%

23.00%

-2.10%

1997

35.50%

33.40%

2.10%

1998

16.80%

28.60%

-11.80%

1999

-5.40%

21.00%

-26.40%

2000

10.10%

-9.10%

19.20%

2001

10.80%

-11.90%

22.70%

2002

-9.90%

-22.10%

12.20%

2003

25.40%

28.70%

-3.30%

2004

15.50%

10.90%

4.60%

2005

3.70%

4.90%

-1.20%

2006

17.30%

15.80%

1.50%

2007

-2.10%

5.50%

-7.60%

2008

-21.90%

-37.00%

15.10%

2009

26.60%

26.50%

0.10%

2010

19.35%

15.06%

4.29%

2011

8.33%

2.11%

6.22%

2012

16.94%

16.00%

0.94%

2013

32.27%

32.39%

-0.12%

2014

15.76%

13.69%

2.07%

2015

0.93%

1.38%

-0.45%

2016

11.83%

11.96%

-0.13%

2017

21.73%

21.83%

-0.10%

2018

-2.73%

-4.38%

1.65%

2019

27.97%

31.49%

-3.52%

2020

8.68%

18.40%

-9.72%

2021

25.99%

28.71%

-2.72%

2022

-6.21%

-18.11%

11.90%


You can see the performance of the Dividend Aristocrats Index versus S&P 500 since 1989. The S&P 500 dominated during the 1990's. However, the Dividend Aristocrats index did very well during the next decade. During the past decade, the Dividend Aristocrats Index has basically matched S&P 500 until early 2020. Over the past two years, it has trailed S&P 500 slightly. 


I first stumbled upon the Dividend Aristocrats index in late 2007, and instantly understood why dividend growth investing is such a powerful wealth generating tool. If someone had invested in the Dividend Aristocrats index after reading my review of the list at the beginning of 2008, they would have tripled their money. 

An investment in the dividend aristocrats a decade ago, would have resulted in a total return of 236.32%. In other words, investing $100 in the Dividend Aristocrats list in December 2011 would have turned into $336.32 by December 31, 2022 . The same amount investing in S&P 500 would have turned into $326.54 however.


As I gained more experience however, I have gravitated more towards the Dividend Champions list, which was created by Dave Fish. The Dividend Champions list is more complete, as it doesn’t exclude companies due to low liquidity, or due to market capitalization below a certain threshold. In addition, I find that historically, the list of Dividend Champions has followed a more consistent approach than the list of Dividend Aristocrats. Sadly, Dave passed away last year. Luckily, another person has agreed to update it for the time being. You can view the 2023 Dividend Champions List here.

When I review the list of historical changes in the Dividend Aristocrats index, I see some inconsistencies in the way portfolio components are added or removed.

For example, the Dividend Aristocrats index removed Altria in 2007, after it spun-off Kraft Foods and as a result its dividend decreased. It could be argued that the dividend income for the investor was not decreased, because they kept getting a dividend from Altria as well as dividends from Kraft Foods.

The S&P committee seems to have rectified this issue, and have kept both Abbott and Abbvie after legacy Abbott Laboratories split in two companies in early 2013.

Ironically, Dave Fish had Altria listed as a Dividend Champion. However, he didn’t have Abbott nor Abbvie listed as a dividend champion ( they are listed as Dividend Aristocrats however).


This is why you need to perform your own checks as an investor.

In addition, I wanted to let you know that I would not purchase all companies from either lists blindly. I run my entry criteria screen to come up with a list of companies for further research. Before investing in any individual stock, I research it enough to gain some understanding of the business and its trends in fundamentals.

Relevant Articles:

Dividend Champions, Contenders & Challengers: The most complete list of US dividend growth stocks available
Dividend Aristocrats List for 2017
Dividend Aristocrats for Dividend Growth and Total Returns
Where are the original Dividend Aristocrats now?
Historical changes of the S&P Dividend Aristocrats
Why do I like the Dividend Aristocrats?
Dividend Aristocrats List for 2016

Popular Posts