Wednesday, May 4, 2022

Tom Russo and the Capacity to Suffer and the Capacity to Reinvest

I like to study successful investors, as part of my effort to continuously improve on my process. Tom Russo is one such investor. I believe I can learn from him.

Between 1990 and 2021, his fund, Semper Vic Partners delivered a total return of 12% to its investors. This was better than the 11.10% return of Dow Jones Industrials average and 10.50% return on S&P 500. Russo invests in a few select industries like industry food, tobacco, media and beverages in which companies have historically proven their ability to generate high and sustainable returns on capital.

His strategy seems to focus on the type of solid blue chip companies that deliver slow but steady performance. These businesses tend to generate a ton of free cashflows and tend to distribute a ton of cashflows to shareholders in the forms of dividends and buybacks, while still growing over time. In addition, these businesses have a product or service that is relatively recession resistant. Such businesses tend to think about the long-term, but sadly are rarely available at discounted valuations. Russo says investors should look to buy businesses with some margin of safety that comes when these businesses are available at a sufficient discount from their actual value.

The businesses he focuses on are companies with leading brands, such as Nestle or Brown Forman, which operate globally. They have powerful brands that are globally known, which give them the ability to enter new markets and grow market shares in different countries. A strong brand commands price elasticity and drives recurring revenue and high return on capital, and reduces the risk of the business model. Price elastic demand is crucial because loyal consumers will be willing pay a higher price should inflation drive up ingredient cost and the company needs to maintain its margin through higher prices.

This has been the case in emerging markets over the past 30 years. Riding the wave of increased prosperity and emerging growth has been beneficial for global brands. When they enter, the market may not be  developed, which means that these brands should have the capacity to suffer throughout the initial phase of market development and the development of the country they just launched operations in. However, as the country grows its economy, its consumers grow their disposable income, the market demand increases, which is good for business. These businesses also have the capacity to reinvest a portion of their income, at a high hurdle rate of return, in order to build the base for future dividend growth. He basically looks for companies with two characteristics – the capacity to suffer and the capacity to reinvest.

He was able to invest in companies like Nestle as early as the late 1980s and early 1990s, when it was much harder for US investors to access this security. He does use Nestle as an example of a company that can enter a new market and invest there to build up its operations with a long term focus. It can "suffer" low profits initially, but with the expectation to make more profit down the road. This of course is possible because of the diversified nature of its global operations, which can temporarily subsidize future ventures. Nestle shareholders of course have enjoyed a streak of rising dividends since 1995.

Tom Russo also looks at family controlled businesses, because he has found that these types of companies tend to think long-term, and avoid the short-term pressures of Wall Street. These are businesses that do not care about beating a quarterly estimate by Wall Street. Instead, they think about years, if not decades, down the road. This is particularly powerful when you are dealing with some of the staples, which have more predictable demand for their goods. These companies are willing to reinvest for the future, even if it means some short-term pain. 

The nature of the companies he invests in shows me that he invests in consumer products companies like food, beverage, tobacco and media. A lot of these businesses have been around for a long time, have strong brands, some pricing power and a relatively inelastic demand. They are market leaders in their niche, and would likely be around decades from now. An investor who buys at the right price would likely generate a steady stream of growing dividends, fueled by a steady compounding in earnings per share over decades. These are the types of companies with a long future runway that patient buy and hold investors like to invest in.

If you look at the companies in his portfolio, you can see that these companies have strong global brands, they have benefitted from international expansion, and the rise in international consumerism. These companies include Nestle, Mastercard, Unilever, Philip Morris, Brown-Forman, Google.
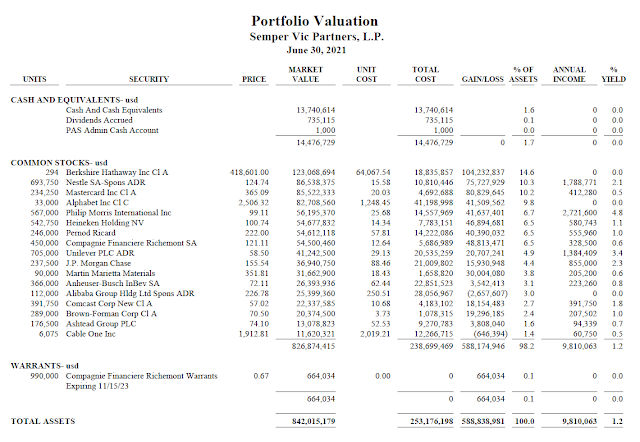


You can read more about Tom Russo here.

There is a talk he did on Global Value Investing.

He also explained his strategy with Consuelo Mack a few years ago here.

I enjoyed this article from Morningstar: Tom Russo: Good investors must have the "capacity to suffer"


I like this transcript from the 8th Value Investor Conference. Check this transcript out from the 3rd Value Investor Conference as well


Monday, May 2, 2022

Sixteen Dividend Growth Stocks Raising Dividends Last Week

I review the list of dividend increases every week, as part of my monitoring process. I usually focus my attention on the companies with a ten year streak of annual dividend increases, and then review each company using my criteria. I am always on the lookout for new ideas, and to determine if my existing holdings are working. I also want to be ready to act quickly, when the right time arrives.

This exercise helps me to evaluate companies I already own, and see how they are doing. This is a helpful piece of the puzzle, that would be helpful when/if I decide to add to these companies at the right price.

This exercise also helps me identify companies for further research. A large part of the time is spent reviewing companies, screening for companies, and trying to learn more about companies, their business, etc. 

It is not glamorous at all, but dull and boring. 

But it does pay dividends.

Over the past week, there were several companies raising dividends. The companies include:

This of course is just a list, not a recommendation.

I also wanted to mention that Raytheon Technologies (RTX) also raised dividends by 7.80% to $0.55/share. This is the core of the old United Technologies, which merged with Raytheon in 2020, and then split into three companies - Raytheon Technologies, OTIS and Carrier. 

Because of the way Otis and Carrier proceeded about their dividend policies, immediately after the spin-off, shareholders ended up with less annual income than before the split. Therefore, shareholders effectively received a dividend cut. But I still view Raytheon as a company that didn't cut dividends. It was a rare combination where I didn't sell after a cut, and was rewarded for it. Perhaps because of the confusion, I held on. But the dividend aristocrats, dividend achievers indices have taken the company and spun-off parts off their portfolios.

When I review companies, I look at ten year trends in:

1) Earnings per share
2) Dividend payout ratio
3) Dividends per share
4) Valuation


Since I have some experience evaluating dividend companies, I also modify my criteria based on the environment we are in and the availability of quality companies. If I see a company with a strong business model and certain characteristics that I like, I may require a dividend streak that is lower than a decade. I have also found success in looking beyond screening criteria by purchasing stocks a little above the borders contained in a screen.

It is important to be flexible, without being too lenient.

You may like this analysis of Sysco (SYY) as an example of how I review companies.

Relevant Articles:


Companies included in this article: AAPL, AGCO, AMP, AVY, AWK, FDS, GWW, HWBK, IBM, K, LBAI, MET, PH, RRX, SYY, UNTY

Saturday, April 30, 2022

The Initial Grind Is The Hardest

I started my website over fourteen years ago in early 2008. During that time I shared my process of looking for and analyzing companies. I discussed my strategy in detail, delved into topics such as building and monitoring a portfolio. I have discussed resources I use, books I have read, and investors who have inspired me.

Back in 2018, I decided to put all of this information to practical use in real time, and launch a premium newsletter where I show investors how I am building a dividend portfolio from scratch. After investing in this portfolio for 44 months as of April 2022, I have learned a few lessons that are applicable to almost anyone investing in dividend growth stocks.

The goal of this dividend portfolio is to generate $1,000 in monthly dividend income after investing $1,000/month for a certain period of time. I try to allocate the money each month in ten attractively valued companies. It is exciting to launch a new portfolio from scratch, and watch it grow by applying my principles in real time. But investing is a long-term process. This project will go on for at least a decade. As such it is more of a marathon than a sprint.

I have invested $53,300 so far in 83 companies through April 30th, 2022. The portfolio is projected to generate $1730.27 in annual dividend income. This comes out to $144.19 in monthly dividend income, and takes us to around 15% of our long-term dividend goal. The forward dividend income has steadily increased since launching of the newsletter in July 2018. I expect this trend to continue, driven by new investments, dividend reinvestment and dividend growth.


Currently, the impact of new capital contributions drives most of the gains in forward dividend income. The rate of dividend growth is not as significant, given the small relative capital and dividend base. After a few years of investing however, the impact of dividend growth will be much more powerful than the impact of new contributions. This is why when investing, I need to play a long-term game, and focus on companies that can grow earnings and dividends 5 - 10 - 20 years down the road. In an uncertain world, I need to focus on companies with business models that can endure most calamities. Yet, I also need to be diversified, in order to protect against tail risks.

The portfolio has had 207 dividend increases since the launch of the newsletter. We had only three dividend suspensions and two dividend cuts. When we do have a dividend cut, I sell the security with a cut one second after the announcement, and buy something else with the proceeds. I may reconsider a dividend cutter after I have sold it, once it starts growing dividends again. I have had two dividend freezes, which is when companies keep dividends unchanged. I will continue holding, but not sell.

The amounts of dividend income quoted today are low. However, this is just the beginning. Plus, I believe that what I am presenting to you is a strategy/system for achieving long-term financial goals and objectives. This is the type of investment program I have followed in my personal portfolio for over a decade.

By following a consistent program of making regular new investments, reinvesting dividends selectively and patiently holding on to those shares, we have created a virtuous cycle which increases chances of financial success. Best of all, investing is a scalable activity. The same amount of effort is needed to invest $1,000 or $10,000 or $100,000.

The initial grind is always the hardest part of investing. When you buy $1,000 worth of shares, and you generate $30- $40 in annual dividend income, it is easy to get discouraged.

For those rare individuals like you and me however, that first $30 - $40 in annual dividend income is pretty exhilarating. You get your a-ha moment when you see that passive dividend income as your stepping stone towards your eventual financial independence. Once you make the investment, you realize that money is working hard for you, so that you don’t have you. You see each dollar invested as a dollar that will grow dividend income for you, without any additional effort. Similar to building a house brick by brick, you see the process of building a dividend portfolio through the lens of each individual purchase.

You realize that with every single investment you make, you are buying your financial freedom.

After several years of investing, the amounts of dividend income start getting noticeable.

After several years of patiently buying quality blue chip companies, reinvesting the dividends and holding those shares for the long term, the dividend income starts getting some real traction. This is the point where the powerful force of compounding starts to overtake the monthly amounts that are added to the portfolio.

To summarize, the system for building wealth and passive income is really simple:
  • Buy quality dividend growth stocks every month 
  • Hold those shares for as long as the dividends are not cut 
  • Reinvest dividends selectively 
  • Maintain a diversified portfolio 
  • Be a patient buy and hold investor

Investors with a long-term outlook, who won't despise the days of small beginnings, and who patiently accumulate assets stand a chance to reach their financial goals and objectives.

You can sign up for a seven day free trial for the Dividend Growth Investor Newsletter by clicking on this link. If you have read this site for the past decade or more, you will likely enjoy the newsletter as well.

Relevant Articles:

Tuesday, April 26, 2022

Utility Companies Between 1929 and 1992

I enjoy collecting old pieces of information, which aid me in my research. A few years ago, I started collecting old editions of Moody's Stock Manuals when they were available for sale at low prices at Amazon or Ebay.

I was browsing through the 1993 Moody's Manual of Dividend Achievers, and found the following chart of the Moody's Utility Stock Index between 1929 and 1993. 

I really like this chart, because it shows the price for the index, as well as the trends in earnings per share, and dividends per share. It would have been even better if it included total returns, of course, but I would get what I can.

I find this chart to hold a ton of interesting information, that few are aware of today. A picture is truly worth 1,000 words.

You can see that the price index of utilities in the US basically went nowhere between 1929 and 1993. That's because it only looks at stock prices.

You can see that the whole return for this index was derived from dividends, over a long period of 64 years.

Why is that?

First of all, utilities were considered "growth stocks" in the 1920s and 1930s. The electricity consumption was rising for example, and was expected to grow because more customers were going to be connected to the grid. There was a big boom, couple with a lot of investment in anticipation of the future growth. Then, there was also some fraud and manipulation, which is just normal human nature when too much easy money is floating around. A lot of companies were overleveraged as well. As you can see, utility stocks were expensive in 1929.

Then the US experienced the crash of 1929, followed by the collapse of many banks, mass unemployment, and an economic depression. This is referred to in the history books as "The Great Depression". 

You can see that utility earnings declined between 1929 and 1934, which dragged share prices and dividends down along with them. 

There were a few regulatory events happening at the time, which broke down some utilities. The 1930s were a time of largely flat earnings, dividends and share prices. 

Since the 1940s however, utilities started earning more and raising dividends to shareholders. The late 1930s and up until 1940s, utilities were selling at low valuations and offering high yields to investors. Interest rates were artificially low at the time too, similarly to what we saw in 2019 - 2021.

They were depressed however, and probably there was little investor interest. After all, memories from the 1929 - 1933 crash were still there. The utility stock index had declined from 120 to 20, which definitely lost investors money. We should also remember that in the 1920s and early 1930s, it was possible to buy stocks on margin by putting only 10% down. Therefore, if a stock went down by 10%, you were wiped out.

This just shows you that it is important to buy at a good price, without overpaying. It is also important to take speculative bubbles with a big grain of salt. While folks in 1929 were right to expect mass growth in utilities revenues and consumption over the next century, they were not properly compensated for it. That's because they paid high prices for future growth, and invested in overleveraged conglomerates that may have lacked in internal controls and didn't care much for investors money. They also invested in speculative companies that failed. 

While utility companies are considered to be safe today, that's mostly due to the past 80 years. The utility companies from the 1920s and even 1930s were viewed as more growthy companies. Each industry goes through a cycle like this, where it is the new kid on the block that excited investors, who euphorically bid up stocks to the sky. After all, this is a new industry that would revolutionize something. After the bubble pops, investors do not want to touch it with a ten foot pole. That's usually when it is the best time to invest. In the meantime, the industry matures, and starts attracting more seasoned investors.

However, in the 1940s, utilities were very cheap and investors were properly compensated for the risks they took. Despite the fact that interest rates rose from 1940s to 1960s, utility stocks went up in price, their earnings rose and dividends rose. That's because there was an adequate margin of safety in the 1940s and utilities had cleaned up their act from the excesses of the "Roaring 20s".


Utilities kept earnings more and growing dividends through the late 1980s. However, utility stock prices peaked in the middle of the 1960s and then started trending downwards through 1974. There was a big bear market in 1972 - 1974, which explains just part of the story.  After bouncing from the 1974s lows, utilities trended sideways through the late 1970s, despite earning more. That's because interest rates were really rising in the 1970s, due to high inflation.

However, the other factor to consider is that inflation started going up in the 1960s and really increased in the 1970s. As a result, interest rates started growing as well, until reaching close to 20% in the early 1980s.

Interest rates act like a gravitational pull for equities. As a result of rising interest rates, share prices declined, because investors demanded higher dividend yields and lower P/E ratios as a compensation.  It also means that taking on loans to finance new projects is more expensive too. Furthermore, rising interest rates means that cost of capital is higher, and it also means that new projects are more expensive to finance. Therefore less projects may get done, and less future earnings can be generated from that. 

Rising inflation also means that it costs more to maintain and upgrade and run a company. Luckily, utility companies can pass on costs to consumers, albeit at a delay. This is where it really depends whether your state is more business friendly or more consumer friendly. 

Of course, this index shows how a group of utility companies performed during that long period of time. There was turnover in the group of companies that comprised the index. Plus, some companies did better than others. For example, Con Edison (ED) ended up cutting dividends in 1974, because it used oil to generate electricity. When oil prices spiked, the company was in real trouble and had to be effectively bailed out. 

There were some utilities that had other issues. The Three Mile Incident was a major disaster in the US, which altered the public opinion on Nuclear Energy. The company that owned it, ended up suspending dividends in the late 1970s.

I am posting this, in order to provide some more context behind this long-term chart of Utility prices, earnings and dividends from 1929 - 1993.

You can see that after interest rates peaked in early 1980s and started going down, utility company share prices started rising and eventually surpassed the highs from the 1960s and even reached all-time-highs by the 1990s.

It does look that utility earnings stopped growing in the latter part of the 1980s and dividends didn't grow by much in the latter part of the 1980s. I believe that they grew from there, albeit slightly. 

You can view a chart of US interest rates between 1790 and 2010 here for reference:


Source:

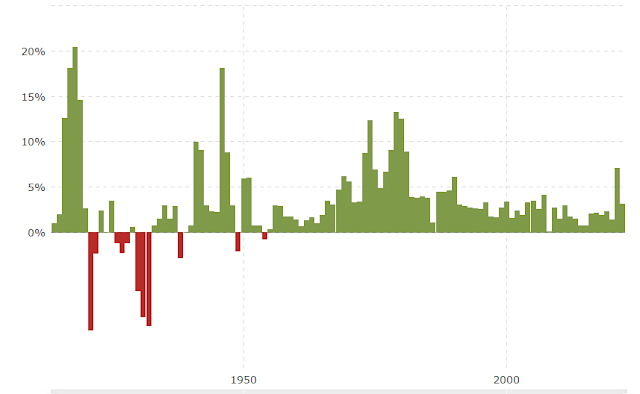
You can also view the annual inflation rate in the US sine 1900 in the chart below:


Source:

Why am I posting this information?

Mostly because I view it as an interesting historical lesson, which contains traces of information that could be beneficial for investors. For example, I believe that bubbles created in new industries are something that you would see over a 30 - 40 year history as an investor. So it may pay to educate as much as possible on the topic. I am of course, just scratching the surface on the topic.

The other reason is because it is possible that the current environment does turn into something that resembles the situation from the 1970s. This is where higher inflation and higher interest rates push share prices lower, even if companies earn more and grow dividends. This means that paying too high of an entry multiple for shares may not be a good idea if interest rates are about to rise dramatically. That's because multiples would likely shrink. (e.g. from a P/E of 30 to a P/E of 10)

In addition, it is important to focus on companies where earnings grow, because that could ensure that dividends can grow and compensate for the eroding power of inflation.

Long term returns are a function of:

1) Initial dividend yield

2) Growth in earnings per share

3) Change in valuations

If you overpay massively at the start, and growth is slow, while valuation shrinks, you may be in for trouble. This is the time where you need to review each company you own, and determine if it can deliver a return on investment in various scenarios.

For example, Con Edison (ED) is selling for 21.50 times forward earnings today. It yields 3.27%. The stock is at an all time high. This dividend aristocrat has managed to grow dividends for 48 years in a row. However, it has a ten year dividend growth of 2.60%.

Earnings per share have gone from $3.86/share in 2012 to $3.85/share in 2021. This is the type of investment that may not be able to grow dividends fast enough in an inflationary environment, so their dividends would lose purchasing power. In addition, the stock may decline if the P/E ratio declines and the dividend yield increases. This is the type of quick review I would do.

Relevant Articles:

- How Dividend Growth Investors can prosper even if interest rates increase

- How dividends protect income from inflation

- Interest Rates Affect Stock Valuations

- A Look Under the Hood For Inflation


Sunday, April 24, 2022

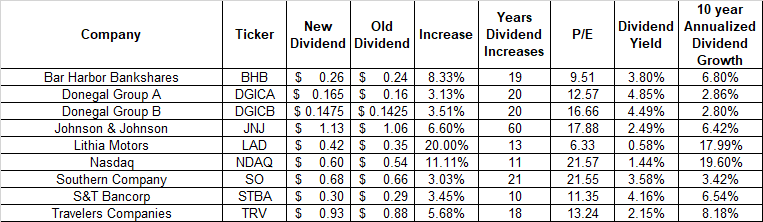
Eight Dividend Growth Stocks Raising Distributions

I review the list of dividend increases every week, as part of my monitoring process. I usually focus my attention on the companies with a ten year streak of annual dividend increases, and then review each company using my criteria. I am always on the lookout for new ideas, and to determine if my existing holdings are working. I also want to be ready to act quickly, when the right time arrives.

This exercise helps me to evaluate companies I already own, and see how they are doing. This is a helpful piece of the puzzle, that would be helpful when/if I decide to add to these companies at the right price.

This exercise also helps me identify companies for further research. A large part of the time is spent reviewing companies, screening for companies, and trying to learn more about companies, their business, etc. 

It is not glamorous at all, but dull and boring. 

But it does pay dividends.

Over the past week, there were several companies raising dividends. The companies include:


This of course is just a list, not a recommendation.

I also wanted to mention Lindt & Sprüngli, which raised its annual dividend by 9.09% to 1,200 Swiss Francs/share. This is the 27th year in a row that the company has increased the annual dividend. It is traded on the Swiss stock market, although the stock is also traded as an ADR on the OTC market in the US. The stock is expensive based on absolute share price and based on valuation however. 

When I review companies, I look at ten year trends in:

1) Earnings per share
2) Dividend payout ratio
3) Dividends per share
4) Valuation


Since I have some experience evaluating dividend companies, I also modify my criteria based on the environment we are in and the availability of quality companies. If I see a company with a strong business model and certain characteristics that I like, I may require a dividend streak that is lower than a decade. I have also found success in looking beyond screening criteria by purchasing stocks a little above the borders contained in a screen.

It is important to be flexible, without being too lenient.

You may like this analysis of Johnson & Johnson (JNJ) as an example of how I review companies.

I would expect further dividend increases next week from Apple (AAPL), Ameriprise Financial (AMP) and W.W. Grainger (GWW). 

Relevant Articles:


Companies discussed in this post: BHB, DGICA, DGICB, JNJ, LAD, NDAQ, SO, STBA, TRV


Popular Posts