I enjoy collecting old pieces of information, which aid me in my research. A few years ago, I started collecting old editions of Moody's Stock Manuals when they were available for sale at low prices at Amazon or Ebay.
I was browsing through the 1993 Moody's Manual of Dividend Achievers, and found the following chart of the Moody's Utility Stock Index between 1929 and 1993.
I really like this chart, because it shows the price for the index, as well as the trends in earnings per share, and dividends per share. It would have been even better if it included total returns, of course, but I would get what I can.
I find this chart to hold a ton of interesting information, that few are aware of today. A picture is truly worth 1,000 words.
You can see that the price index of utilities in the US basically went nowhere between 1929 and 1993. That's because it only looks at stock prices.
You can see that the whole return for this index was derived from dividends, over a long period of 64 years.
Why is that?
First of all, utilities were considered "growth stocks" in the 1920s and 1930s. The electricity consumption was rising for example, and was expected to grow because more customers were going to be connected to the grid. There was a big boom, couple with a lot of investment in anticipation of the future growth. Then, there was also some fraud and manipulation, which is just normal human nature when too much easy money is floating around. A lot of companies were overleveraged as well. As you can see, utility stocks were expensive in 1929.
Then the US experienced the crash of 1929, followed by the collapse of many banks, mass unemployment, and an economic depression. This is referred to in the history books as "The Great Depression".
You can see that utility earnings declined between 1929 and 1934, which dragged share prices and dividends down along with them.
There were a few regulatory events happening at the time, which broke down some utilities. The 1930s were a time of largely flat earnings, dividends and share prices.
Since the 1940s however, utilities started earning more and raising dividends to shareholders. The late 1930s and up until 1940s, utilities were selling at low valuations and offering high yields to investors. Interest rates were artificially low at the time too, similarly to what we saw in 2019 - 2021.
They were depressed however, and probably there was little investor interest. After all, memories from the 1929 - 1933 crash were still there. The utility stock index had declined from 120 to 20, which definitely lost investors money. We should also remember that in the 1920s and early 1930s, it was possible to buy stocks on margin by putting only 10% down. Therefore, if a stock went down by 10%, you were wiped out.
This just shows you that it is important to buy at a good price, without overpaying. It is also important to take speculative bubbles with a big grain of salt. While folks in 1929 were right to expect mass growth in utilities revenues and consumption over the next century, they were not properly compensated for it. That's because they paid high prices for future growth, and invested in overleveraged conglomerates that may have lacked in internal controls and didn't care much for investors money. They also invested in speculative companies that failed.
While utility companies are considered to be safe today, that's mostly due to the past 80 years. The utility companies from the 1920s and even 1930s were viewed as more growthy companies. Each industry goes through a cycle like this, where it is the new kid on the block that excited investors, who euphorically bid up stocks to the sky. After all, this is a new industry that would revolutionize something. After the bubble pops, investors do not want to touch it with a ten foot pole. That's usually when it is the best time to invest. In the meantime, the industry matures, and starts attracting more seasoned investors.
However, in the 1940s, utilities were very cheap and investors were properly compensated for the risks they took. Despite the fact that interest rates rose from 1940s to 1960s, utility stocks went up in price, their earnings rose and dividends rose. That's because there was an adequate margin of safety in the 1940s and utilities had cleaned up their act from the excesses of the "Roaring 20s".
Utilities kept earnings more and growing dividends through the late 1980s. However, utility stock prices peaked in the middle of the 1960s and then started trending downwards through 1974. There was a big bear market in 1972 - 1974, which explains just part of the story. After bouncing from the 1974s lows, utilities trended sideways through the late 1970s, despite earning more. That's because interest rates were really rising in the 1970s, due to high inflation.
However, the other factor to consider is that inflation started going up in the 1960s and really increased in the 1970s. As a result, interest rates started growing as well, until reaching close to 20% in the early 1980s.
Interest rates act like a gravitational pull for equities. As a result of rising interest rates, share prices declined, because investors demanded higher dividend yields and lower P/E ratios as a compensation. It also means that taking on loans to finance new projects is more expensive too. Furthermore, rising interest rates means that cost of capital is higher, and it also means that new projects are more expensive to finance. Therefore less projects may get done, and less future earnings can be generated from that.
Rising inflation also means that it costs more to maintain and upgrade and run a company. Luckily, utility companies can pass on costs to consumers, albeit at a delay. This is where it really depends whether your state is more business friendly or more consumer friendly.
Of course, this index shows how a group of utility companies performed during that long period of time. There was turnover in the group of companies that comprised the index. Plus, some companies did better than others. For example, Con Edison (ED) ended up cutting dividends in 1974, because it used oil to generate electricity. When oil prices spiked, the company was in real trouble and had to be effectively bailed out.
There were some utilities that had other issues.
The Three Mile Incident was a major disaster in the US, which altered the public opinion on Nuclear Energy. The company that owned it, ended up suspending dividends in the late 1970s.
I am posting this, in order to provide some more context behind this long-term chart of Utility prices, earnings and dividends from 1929 - 1993.
You can see that after interest rates peaked in early 1980s and started going down, utility company share prices started rising and eventually surpassed the highs from the 1960s and even reached all-time-highs by the 1990s.
It does look that utility earnings stopped growing in the latter part of the 1980s and dividends didn't grow by much in the latter part of the 1980s. I believe that they grew from there, albeit slightly.
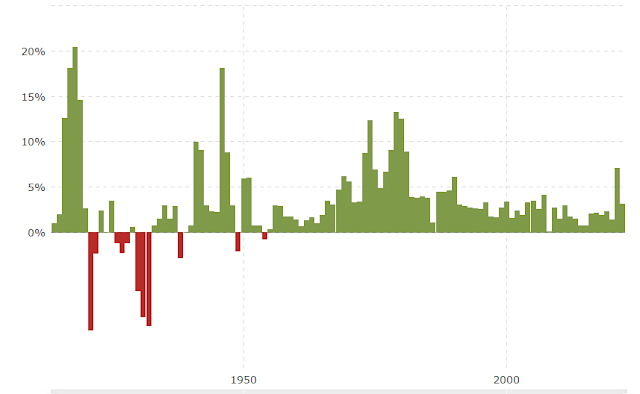
You can view a chart of US interest rates between 1790 and 2010 here for reference:
Source:You can also view the annual inflation rate in the US sine 1900 in the chart below:
Source:Why am I posting this information?
Mostly because I view it as an interesting historical lesson, which contains traces of information that could be beneficial for investors. For example, I believe that bubbles created in new industries are something that you would see over a 30 - 40 year history as an investor. So it may pay to educate as much as possible on the topic. I am of course, just scratching the surface on the topic.
The other reason is because it is possible that the current environment does turn into something that resembles the situation from the 1970s. This is where higher inflation and higher interest rates push share prices lower, even if companies earn more and grow dividends. This means that paying too high of an entry multiple for shares may not be a good idea if interest rates are about to rise dramatically. That's because multiples would likely shrink. (e.g. from a P/E of 30 to a P/E of 10)
In addition, it is important to focus on companies where earnings grow, because that could ensure that dividends can grow and compensate for the eroding power of inflation.
Long term returns are a function of:
1) Initial dividend yield
2) Growth in earnings per share
3) Change in valuations
If you overpay massively at the start, and growth is slow, while valuation shrinks, you may be in for trouble. This is the time where you need to review each company you own, and determine if it can deliver a return on investment in various scenarios.
For example, Con Edison (ED) is selling for 21.50 times forward earnings today. It yields 3.27%. The stock is at an all time high. This dividend aristocrat has managed to grow dividends for 48 years in a row. However, it has a ten year dividend growth of 2.60%.
Earnings per share have gone from $3.86/share in 2012 to $3.85/share in 2021. This is the type of investment that may not be able to grow dividends fast enough in an inflationary environment, so their dividends would lose purchasing power. In addition, the stock may decline if the P/E ratio declines and the dividend yield increases. This is the type of quick review I would do.
Relevant Articles:
- How Dividend Growth Investors can prosper even if interest rates increase
- How dividends protect income from inflation
- Interest Rates Affect Stock Valuations
- A Look Under the Hood For Inflation