Realty Income $O stock has declined by 42% off the all-time-highs set in February 2020 of $82.23/share
It's still above the pandemic lows of $36.80/share from March 2020. The share price is 36% below the highs of $75/share set in 2022.
I decided to take a look at previous large drawdowns, for perspective. Largely, each crisis and drawdown were different. Yet, despite all that, Realty Income managed to overcome that crisis, and keep growing FFO/share and dividends/share. Past performance is not an indication for future results. But as an equity analyst, that's all the information I can base my decisions on. My guess about the future is as good as yours. But it does seem plausible that a company that overcame a lot of calamities in the past would likely be prepared to overcome future calamities as well. Let's circle back in 5 years to tell me if I was totally wrong or on the right path...

The first drawdown was around the time Covid hit.
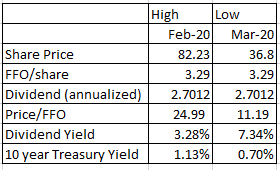
The stock went down from a high of $82.23 in Feb 2020 to a low of $36.80 in Mar 2020. The valuation went from 25 times FFO and a dividend yield of 3.28% in February 2020 to 11.20 times FFO and a 7.34% dividend yield in March 2020.
That was a 55% decline. The lockdowns were hard on the retail sector, as many locations were ordered shut down by the government. Despite all of that, Realty Income managed to collect most of the rent, and kept raising dividends and growing FFO/share.
Interest rates did decline during that time period, though we also had a great depression type situation that compressed a depression into a couple of months. The speed of the drop was scary.
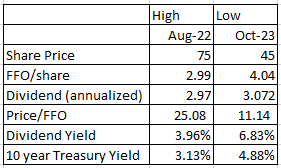
FED Raising Rates since 2022
While the stock did not exceed the 2020 highs, it reached a high of $75 in 2022. We are now a little over an year into this drawdown. Yet, FFO/share is growing along the way...
The valuation went from 25 times FFO and a dividend yield of 3.96% in August 2022 to 11.15 times FFO and a 6.83% dividend yield in October 2023.
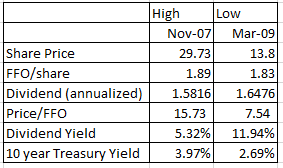
Global Financial Crisis
Around the time of the Global Financial Crisis, the stock topped at $29.73/share in November 2007. It then proceeded to decline all the way down to $13.80/share by March 2009. That's an almost 54% decline in about an year and a half. Note the stock reached an all time high of $33.76 briefly in September 2008, but that was mostly as short selling on financials was banned in the US, which spurred short covering.
The valuation went from 15.70 times FFO and a dividend yield of 5.32% in November 2007 to 7.54 times FFO and a 11.94% dividend yield in March 2009.
That was a dark time, because of the Great Recession. Many people lost their jobs, companies closed doors, and the economy was in a recession. The Retail sector was in trouble, along with real estate as well. The Housing Bubble affected everything. Despite all of that, Realty Income managed to maintain FFO/share and even grow dividends to maintain its streak.
The Global Financial Crisis had issues that were core to the economy. We had softness that was overcome by declining rates. The credit markets were frozen at one point however, which made accessing capital harder.
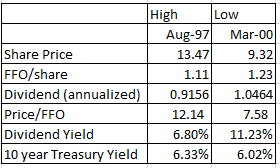
Late 1990s, Dot-Com Bubble and Rising Rates
The next decline occurred at the end of the 1990s. The stock reached a high of $13.47/share in August 1997. It then proceeded to decline for 3 years, until it reached a low of $9.32/share in March 2000. This decline was driven by a few different factors, but it does remind me somewhat of the current decline.
The valuation went from 12.15 times FFO and a dividend yield of 6.80% in August 1997 to 7.58 times FFO and a 11.23% dividend yield in March 2000.
That's because demand for hot growth equities and the new economy caused investors to abandon any traditional metrics of value, and pursue the future at any price. In addition, interest rates were increased at a fast pace starting in 1999, reaching their highs in 2000.
REITs were so unloved in 1999 - 2000, that they even sold for less than liquidation values. They frequently offered yields that were close to 10%. At the lows in 2000, Realty Income yielded close to 11%.
10 year treasuries yielded about 6.50% - 7% at the time.
Despite the valuation compression, the REIT kept growing FFO/share, and raising dividends. Investors who were paid to hold through the ups and downs persevered and were ultimately rewarded.
The early 2000s were actually a very good time to be a REIT investor (prior to 2008). Valuation multiples that were compressed prior to that, finally increased to more reasonable levels. Investors understood the value and were willing to pay more. The growth at any price crowd lost a ton of money.
Conclusion:
I hope you enjoyed this historical review of Realty Income's past declines. It really helps put the current drawdown in perspective. As a long-term Dividend Growth Investor, I buy a company at a good valuation, and hold on to it through thick or thin, for as long as the dividend is not cut. I plan to keep on holding on to my Realty Income stock for as long as the dividend is not cut. It is easier to hold psychologically, when I am paid to hold. And it's even easier when the amounts I am paid to hold tend to increase as well.