Saturday, March 30, 2024

Dollar Cost Averaging Versus Lump Sum Investing

Dollar cost averaging is a process, where the same amount of funds is allocated to preset investment/s at regular intervals of time. It is widely believed that investors who choose to systemically allocate funds towards their investments are reducing their risk of investing their whole amount at the top of the price range.

Most individuals use dollar cost averaging to purchase investments. The reason behind these actions is the fact that most individuals are able to allocate funds for investing once a month or every two weeks for example, depending on the frequency with which they are able to save money. If our investor is able to save 15% of their illustrative $1000 monthly salary, which is paid every two weeks or twice/month, they would be able to allocate anywhere between $150 - $225 every month towards their retirement investments. The $225/month is derived for the situation where a person who is paid bi-weekly ends up receiving three paychecks instead of three. Either way, the typical 401 (k) investor would purchase the same funds whenever they get paid. The typical dividend investor would likely accumulate new contributions with any distributions from their portfolios, before they make their stock investments. Depending on portfolio sizes, minimum amount of purchases and amount of distributions per month, dividend investors end up purchasing different dividend stocks on a regular basis, which closely mimics the practice of dollar cost averaging.

Unfortunately, few investors have large amounts of cash simply sitting around, that they need to dollar cost average. For those lucky enough to have this happen to them, dollar cost averaging can be a tool to minimize risk of purchasing at the top. It would also help them in gaining more experience in the markets, particularly if they had none whatsoever previously. For lottery winners or those lucky individuals who happen to obtain a lump sum of cash, dollar cost averaging might be a great way to handle the bounty.

In order to test whether dollar cost averaging gives investors an advantage over lump sum investing, I obtained monthly data for the Vanguard S&P 500 mutual fund (VFINX) between 1986 and 2023. In order to calculate dollar cost averaging results for a given year, I would put $100 in investment every month beginning in the last day of the last month of the previous year, up until the last day of November for the next year. For lump-sum amounts, I would put a theoretical $1200 investment either at the closing prices for the previous year. I would then multiply the number of shares accumulated for both dollar cost averaging and lump sum investing times the ending prices by the end of the current year. Next, I would then compare which strategy delivered better results for the given year.


Overall, lump-sum investing performed better in 31 out of 38 years. Dollar cost averaging performed better in only 7 out of 38 years. Not surprisingly, these were the years when the stock market was either flat or declined. As a result, dollar cost averaging reduces investor’s risk when things were difficult, but at the expense of foregone gains when things went well. Because stocks have a historical tendency to move up over time, investors who practice dollar cost averaging might be at a disadvantage. Of course, for those who practice dollar cost averaging because they didn’t have the lump-sum in the first place, this is still the best way to accumulate a sizeable nest egg.

In this exercise we did not look at other key components of investment which deals with investment selection, analysis, valuation and purchase. We assumed that these decisions have already been made. In reality however, there could be a situation where our investor might not find any potential assets that have sufficient low valuation to merit investment in them. Most index investors or savers in a 401 (k) invest regardless of overall valuations.

Relevant Articles:

How to accumulate your nest egg
How to retire in 10 years with dividend stocks
Optimal Cash Allocation for Dividend Investors
How to Generate an 11% Yield on Cost in 6 Years
How to be a successful dividend investor

Wednesday, March 27, 2024

Blind Spots and Continuous Improvement

As an investor, I am aware that I have a lot of blind spots. Someone with a glass half full outlook on life might say that I have a lot of room for improvement though.

I do believe that successful investment is about continuous improvement, which is only possible through active learning. That includes reading books, articles, journals but most importantly also doing the heavy lifting and actually investing money. It’s very helpful to have a process that helps in most aspects of the investment process:

1. Identify the population

2. Define the traits you are looking for

3. Define the entry criteria that would trigger an investment

4. Define exit criteria that would cause an investment to be sold

5. Manage risk

Naturally, I like to study other investors and their strategies. At least based on what I see publicly.

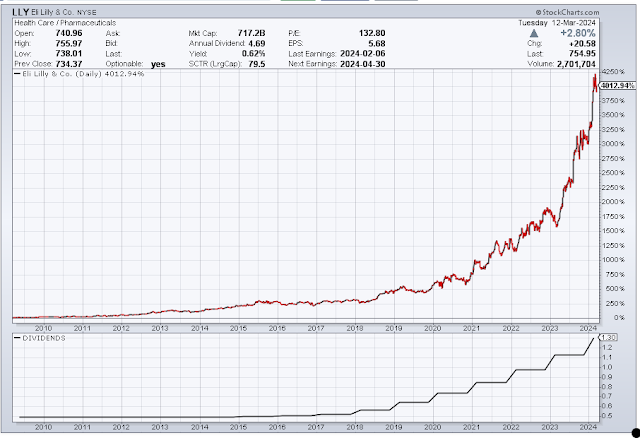
I recently saw that Eli Lilly (LLY) has become one of the largest companies in the US. A lot of investors are salivating over the past 15 years of returns. Yet I doubt most are even aware that this is a dividend stock, and/is/has been a dividend growth stock as well.


The question I have on my mind is: How would one have identified the company as an investment 15 years ago, and would they have actually bought it? 

Naturally, I remembered how Eli Lilly was a dividend aristocrat about 15 years ago or so, with a 40+ year history of annual dividend increases under its belt. The stock sold for 8 times forward earnings in 2009 and yielded about 6%. It had suffered a terrible decade, as earnings were largely flat, and the stock price had nosedived by 60% from its highs in the year 2000. Naturally, the P/E ratio had shrunk significantly too – from 30 - 40 in late 1990s to 8 in 2009. 

You may like my review of Eli Lilly from 2009, back when things were at their bleakest it seems like.

An investor who bought in 2009 for the dividend and stayed, did pretty well. They were getting paid a generous dividend to hold on to a dividend aristocrat. Those sleepy companies can sometimes also surprise on the upside, by uncovering a blockbuster drug in their pipeline. It’s like having your cake and eating it too. It’s not so easy to predict years in advance what or whether the pipeline that takes billions of R&D will produce a blockbuster drug or a series of failures. Still, it’s a nice option on the future, while getting paid to wait.

The company did not really show growth in earnings per share between 1999 and 2009 however. So this shows like it was an unlikely candidate for purchase at the time.

There were a lot of other candidates in 2009 that have done well, whose earnings patterns seemed much more promising (and stayed promising). Those include the likes of Sherwin-Williams, S&P Global (Then McGraw Hill), Cintas, ADP, Grainger, etc. You may like this article from 2008, called "Best Dividend Stocks For the Long Run"

Earnings per share for Eli Lilly were largely flat from 1999 to 2016. The stock is highly unlikely to have been picked up by my process too. Right now it’s simply overvalued.


The company was a dividend aristocrat however. But the dividend growth indexes like the Achievers and Aristocrats that would have held it through 2010 actually sold it at the end of 2010/early 2011. The company had become a dividend achiever in 1977 and a dividend aristocrat in 1992. 

However, the company was dropped from the dividend aristocrat and dividend achiever indices in 2011, after it failed to increase dividends in 2010. This means that all the passive dividend ETFs holding it were forced to sell the company. 

Despite not raising dividends between 2010 and 2014 however, the company never cut them. It started raising them again in 2015. So someone who had bought it because it was a dividend achiever/dividend aristocrat, and didn’t sell due to the dividend freeze would have come out ahead on this one. Of course, they could have also bought it much earlier, such as the 1990s for example. However they would have had to hold through the 2000 – 2009 period, which would have tested their conviction.

The only ones that probably owned it in 2009 and are likely to have owned it through today are your basic index funds on S&P 500 and/or Total Market. Of course, they also held it during the lost decade of 1999 – 2009 as well, when returns were negative.

It’s actually fascinating to study those index funds, because they take long-term buy and hold investing to the next level.

They make a lot of bets, and then they stick to them through thick or thin. They allow the power of compounding to do its magic, and basically never sell. (or at least rarely do).

This allows the best investments to mushroom, and deliver the lions share of profits for truly long-term investors. As we have witnessed before, constant tinkering and turnover are counter-productive and costly, as they detract from returns due to fees, costs, taxes and opportunity costs (e.g. selling winners to buy losers).

As a result, a small number of companies tend to drive total returns forward. The losers become a smaller and smaller portion of the portfolio. Even if they went to zero, there are some huge winners that not only pay for them, but also turn a net profit overall.

This is basically the Pareto Principle in action.

Nobody knows in advance for sure which those winners would be. This is why it’s important to hold that diversified basket through thick or thin, and just stay invested. Second guessing yourself, and trying to pick the winners from the losers is definitely hard. Mostly because it is very hard to predict for sure. Predictions are hard, especially the ones about the future..

Naturally, this gets you thinking. If you missed out on these exceptional winners, your portfolio would likely deliver substandard performance.

Missing out could happen in two major ways actually.

One of the ways you could miss out is because you didn’t buy the stock. Perhaps due to omission, perhaps due to your process missing something or perhaps because the stock did not look investable then. Perhaps it became investable later, but by that time you either missed it because you weren’t monitoring it or because by the time it became investable the stock price was already high enough and recovered to reflect that.

Another of the ways you could miss out is because you sold the stock. 

After studying index funds for a while, I’ve come to the conclusion that it does make sense to hold a lot of companies by placing small bets on them and then holding them. This lets you own a lot of companies, and you would likely profit overall, without even knowing or having to need to have a crystal ball. You have small turnover, which is mostly driven by companies being delisted due to acquisitions/mergers/bankruptcies/delisting (at least looking at the broad total market index that is). Just buy and hold. By not caring about valuation as well, they are less likely to pass on to promising companies merely because they sell at say 25 times forward earnings and not 20 times forward earnings. On the flip side of course is that they may end up overpaying for future growth, dearly. Of course there are trade-offs with everything. The issue of this buying the whole haystack theory is that you have a lot of good businesses mixed in with a lot of bad businesses as well.

Of course, you do not need to buy every company to make money in equities. Having a process to select a group of quality companies, and hold on to them through thick or thin can deliver good results.

This brings us back from the world of broad index funds to the narrow world of dividend funds.

High turnover is one issue with dividend ETFs.

They actually sold out of Eli Lilly in 2011, which basically reduced their returns. 

My lessons from this exercise is to try to work and design portfolios that hold a lot of companies, which rarely sell.

When it comes to the dividend growth investing universe, it apparently takes sense to take a lot of bets, and stay invested with them. An improvement over regular dividend ETFs is to not sell if a company fails to raise dividends. However, it is still likely a good idea to sell if a company cuts/suspends dividends. If a company is acquired, one has to sell regardless.

Of course, that doesn’t mean you should ignore quality as well. Taking lots of bets is fine, but at some point there are also companies that are not doing well financially. They may turn around, or not. But speculating when the date is not supporting speculation is still speculation.

That being said, no process is going to be perfect.


There is always going to be room for improvement.


Sunday, March 24, 2024

Four Dividend Achievers Rewarding Shareholders With Raises

I review the list of dividend increases as part of my monitoring process. This exercise helps me monitor existing holdings. It also helps me identify companies for further research.

I typically focus on the companies that have managed to increase annual dividends for at least ten years in a row.

There were 11 companies that increased dividends last week. There were four companies that raised dividends last week, which have also managed to increase dividends for at least ten years in a row. The companies include:


JPMorgan Chase & Co. (JPM) operates as a financial services company worldwide. It operates through four segments: Consumer & Community Banking (CCB), Corporate & Investment Bank (CIB), Commercial Banking (CB), and Asset & Wealth Management (AWM).

JPMorgan Chase increased quarterly dividends by 9.50% to $1.15/share. This is the 14th consecutive annual dividend increase for this dividend achiever.

Over the past decade, the company has managed to grow dividends at an annualized rate of 11.53%.

Between 2014 and 2023, the company managed to grow earnings from $5.33/share to $16.25/share.

The company is expected to earn $15.96/share in 2024.

The stock sells for 12.32 times forward earnings and yields 2.33%.


Globe Life Inc. (GL) provides various life and supplemental health insurance products, and annuities to lower middle- and middle-income families in the United States. The company operates in four segments: Life Insurance, Supplemental Health Insurance, Annuities, and Investments. 

Globe Life increased quarterly dividends by 6.70% to $0.24/share. This is the 19th consecutive annual dividend increase for this dividend achiever.

During the past decade, the company managed to grow dividends at an annualized rate of 7.21%.

Between 2014 and 2023, the company managed to grow earnings from $4.09/share to $10.21/share.

The stock sells for 10 times forward earnings and yields 0.82%.


Independent Bank Corp. (INDB) operates as the bank holding company for Rockland Trust Company that provides commercial banking products and services to individuals and small-to-medium sized businesses in the United States. 

Independent Bank increased quarterly dividends by 4% to $0.57/share. This is the 14th year of consecutive annual dividend increases for this dividend achiever.

The company has managed to grow dividends at an annualized rate of 9.72% over the past decade.

Between 2014 and 2023, the company managed to grow earnings from $2.50/share to $5.42/share.

The stock sells for 11 times forward earnings and yields 4.43%.


CareTrust REIT, Inc. (CTRE) is a self-administered, publicly-traded real estate investment trust engaged in the ownership, acquisition, development and leasing of skilled nursing, seniors housing and other healthcare-related properties. 

CareTrust REIT increased quarterly dividends by 3.60% to $0.29/share. This is the tenth consecutive annual dividend increases for this newly minted dividend achiever

The REIT has managed to grow distributions at an annualized rate of 6.90% over the past five years.

The stock sells for 15.83 times forward FFO and yields 4.83%.

Relevant Articles:

- 16 Dividend Growth Companies That Increased Dividends Last Week


Monday, March 18, 2024

Schwab Dividend Index 2024 Annual Reconstitution

The Dow Jones U.S. Dividend 100 Index is designed to measure the performance of high-dividend-yielding stocks in the U.S. with a record of consistently paying dividends, selected for fundamental strength relative to their peers, based on financial ratios.

The index universe is defined as the constituents of the Dow Jones U.S. Broad Stock Market Index, excluding REITs.. Source:  S&P Global

Stocks must pass the following screens:

• Minimum 10 consecutive years of dividend payments

• Minimum FMC of US$ 500 million

• Minimum three-month ADVT of US$ 2 million

Stocks that pass all screens are ranked by dividend yield. The top half are eligible for inclusion. 

Constituent selection is as follows:

1. The eligible securities are ranked by each of four fundamentals-based characteristics:

• Free cash flow to total debt: Annual net cash flow from operating activities divided by total

debt. Companies with zero total debt are ranked first.

• Return on equity: Annual net income divided by total shareholders’ equity.

• IAD yield

• Five-year dividend growth rate 

2. The four rankings are equal weighted to create a composite score, and the eligible securities are
ranked based on this composite score.

3. The 100 top-ranked stocks by the composite score are selected to the index, subject to the
following buffer rules that favor current constituents during the annual review.

• The constituent stocks will remain in the index as long as they are among the top 200
rankings by the composite score.
• Non-constituent stocks are added to the index based on their rankings until the
constituent count reaches 100.
• If two non-constituents have the same composite score, the non-constituent with the
higher dividend yield will be selected.


Stocks in the index are weighted quarterly, based on a capped FMC weighted approach. No single stock can represent more than 4.0% of the index and no single Global Industry Classification Standard (GICS®) sector can represent more than 25% of the index, as measured at the time of index construction, annual rebalancing, and quarterly updates. 

The index is subject to a daily weight cap check. If the sum of stocks with weights greater than 4.7% exceeds 22%, the index is re-weighted using a quarterly weighting method.


The index is the benchmark used by the popular dividend ETF the Schwab US Dividend Equity ETF (SCHD). It is rebalanced once per year. This years re-constituting just happened. I actually reviewed the ETF in 2016, and didn't hate it. However I did not buy it then because I did not like the high turnover.

The column on the left shows the 24 companies that were removed. The column on the right shows the 24 companies that were added.


Note I created this list myself by comparing the holdings in the Schwab Dividend ETF today at the Schwab website, versus the holdings int he Schwab Dividend ETF as of Feb 29, available on the Fidelity Study.

It looks like the turnover accounted for something like 24% - 25% of the portfolio weightings. The largest components being taken out include Broadcom (AVGO) with a 5.07% weight, Merck (MRK) with a 4.69% weight and ADP (ADP) with a 3.09% weight.

On a side note, you do not get taxed on those gains from the re-balancing within an ETF as an ETF shareholder. You also do not get any deductions on losses within an ETF from re-balancing either however.

In general I dislike high turnover, because it means that this ETF holds stocks on average for 4 - 5 years only. The number of companies I am investing in is not stable, so in effect it is as if I am investing into a trading strategy almost. I prefer to hold a more passive approach to investing, with low turnover and rarely selling anything. I also prefer to build my own portfolios at home, one company at a time. That way I can control:


1. What companies go in the portfolio
2. The entry valuations
3. Portfolio weights
4. Holding period/Turnover
5. Cost


Whether you should buy individual dividend growth stocks or dividend growth etf however is another trade-off you have to accept for yourself.

Relevant Articles:


Five Dividend Growth Companies Increasing Dividends Last Week

I review the list of dividend increases every week, as part of my monitoring process. This exercise helps me monitor existing holdings but also identify companies for further research. I usually focus on the companies that have managed to increase dividends for at least ten years in a row. 

A long history of annual dividend increases does not happen by accident. It is usually a result of a strong business that generates excess cashflows. But as we all know, past performance is also not always an indication of future results.

This exercise simply puts companies on my list for further research. Afterwards, I review each company briefly, before determining if I should pursue the idea further or set it aside.

Over the past week, there were 23 companies that increased dividends to shareholders in the US. Five of these companies have managed to increase dividends for at least ten years in a row.


Colgate-Palmolive Company (CL)  manufactures and sells consumer products in the United States and internationally. It operates through two segments: Oral, Personal and Home Care; and Pet Nutrition.

The company increased quarterly dividends by 4.20% to $0.50/share. This is the 61st consecutive annual dividend increase for this dividend king. Over the past decade, the company has managed to increase dividends at an annualized rate of 3.68%.

Between 2014 and 2023 the company grew earnings slightly from $2.36/share to $2.77/share. The company is expecting to earn $3.49/share in 2024.

The stock sells for 25.35 times forward earnings and yields 2.26%.


Shoe Carnival, Inc. (SCVL) operates as a family footwear retailer in the United States.

The company increased quarterly dividends by 12.50% to $0.135/share. This is the 12th consecutive annual dividend increase for this dividend achiever. Over the past decade, the company has managed to grow dividends at an annualized rate of 13.56%.

The company has managed to grow earnings from $0.66/share in 2014 to $4/share in 2023. The company is expected to earn $2.70/share in 2024.

The stock sells for 12.06 times forward earnings and yields 1.65%.


Steel Dynamics, Inc. (STLD) operates as a steel producer and metal recycler in the United States.

The company raised quarterly dividends by 8.20% to $0.46/share. This is the 15th consecutive annual dividend increase for this dividend achiever. Over the past decade, the company has managed to increase dividends at an annualized rate of 14.15%.

Between 2014 and 2023, the company managed to grow earnings from $0.68/share to $14.72/share.

the company is expected to earn $10.59/share in 2024.

The stock sells for 13 times forward earnings and yields 1.33%.


UDR, Inc. (UDR), an S&P 500 company, is a leading multifamily real estate investment trust with a demonstrated performance history of delivering superior and dependable returns by successfully managing, buying, selling, developing and redeveloping attractive real estate communities in targeted U.S. markets.

The company increased quarterly dividends by 1.20% to $0.425/share. This is the 14th consecutive annual dividend increase for this dividend achiever. Over the past decade, this REIT has managed to grow dividends at an annualized rate of 5.89%.

UDR grew FFO/share from $1.58 in 2014 to $2.46 in 2023.

This REIT is expected to generate $2.45/share in FFO in 2024.

The stock sells for 15.14 times FFO and yields 4.57%.


Williams-Sonoma, Inc. (WSM) operates as an omni-channel specialty retailer of various products for home.

The company increased quarterly dividends by 26% to $1.13/share. This is the 18th consecutive annual dividend increase for this dividend achiever. Over the past decade, the company has managed to grow dividends at an annualized rate of 11.71%.

Between 2015 and 2024, the company has managed to grow earnings from $3.30/share to $14.71/share.

The company is expected to earn $15.13 in 2024.

The stock sells for 18.76 times forward earnings and yields 1.59%.


Relevant Articles:

- 17 Dividend Growth Stocks Raising Shareholder Distributions


Wednesday, March 13, 2024

The Return of the Dividend

A pattern of steady dividend payments and dividend increases is only possible if a business can generate enough cashflows to support operations and expansion, while also generating torrents of excess free cash flows.

That dividend provides signaling value to shareholders that there are indeed solid and dependable cashflows to support it. Those cashflows are also supported by the business.

In fact, in the old days (prior to the 1980s), investors would not touch a stock that didn't pay a dividend. The idea was that a company which does not pay a dividend simply cannot afford to pay it. It was a speculative company that typically didn't earn much money.

Since the days of the 1990s and the tech bubble, investors have been shunning dividends, and focusing only on the share price. It takes a few bear markets to remind investors that trees do not grow to the sky. 

At some point, a stable dividend generated from a good business can be a major calming force during a bear market or an extended flat market. For a company that generates a ton in cashflows, it makes little sense not to pay a dividend. Dividends provide management with focus on the projects with the highest return on investment. Having that focus and a hurdle rate, coupled with a regular commitment to shareholders, makes it less likely that management teams would do something silly with the money. A stable and growing dividend also signals maturity and stability in cashflows. 

When management teams are swimming in cash, they could focus on projects of dubious value, get more perks like corporate jets, and other silliness. That dividend provides focus and discipline to the capital allocation process.

Over the past several weeks, there were several notable dividend initiators.

Those include:

Meta (META), which initiated a quarterly dividend of $0.50/share in February.

Booking Holdings (BKNG), which initiated a quarterly dividend of $8.75/share in February.

Salesforce.com (CRM), which initiated a quarterly dividend of $0.40/share in February.


It would be interesting to see if these companies manage to grow those dividends from here as well.

It seems as if companies are finally wisening up and sharing their generous cashflows with shareholders.

I would welcome seeing more tech juggernauts that can afford to pay a dividend actually starting to pay dividends. One that's long overdue is Alphabet (GOOG).

It would be interesting to see if number of payers on the S&P 500 increases as well. These are the trends we are witnessing as of this year:


On a side note, this increase in number of dividend paying companies, particularly in the tech sector, is not new. We saw that a little over a decade ago. Please check the relevant articles below:


Relevant Articles:


Monday, March 11, 2024

Six Dividend Growth Stocks Raising Shareholder Distributions

I review the list of dividend increases as part of my monitoring process every week. This exercise helps me review the performance of existing holdings, and potentially identify companies for further research.

It's helpful to point out how I quickly evaluate a company, before deciding if it is worth additional research for potential inclusion in my portfolio.

When I evaluate a company I look at:

1. Trends in earnings per share over the past decade. Without growth in earnings per share, future dividend growth will be difficult. This growth can be achieved in any sort of way, but it is the fuel behind future dividend growth and increases in intrinsic value.

2. Trends in the payout ratio over the past decade. The payout ratio helps me evaluate dividend safety, and in general the lower the ratio the better. However I also want to ensure that growth in dividends is not generated through an increase in the payout ratio over time, because that has a natural limit. There is some nuance here as well, as companies in the initial phase of dividend growth can grow the payout ratio from a low base. But in general, I want to see an adequate payout ratio that is in a range.

3. I like to review the trends in dividend growth, and compare the most recent increases to it. We all want stable rate of dividend growth, but in reality the rate of change tends to fluctuate a little bit. I do not want a decelerating dividend growth, coupled with a recent streak of token dividend raises. Those signal potential trouble ahead. Dividend increases have a signaling effect.

4. I also look at the valuation as well. This takes into consideration P/E ratio, earnings growth, dividend yield, in order to come up with an estimated range of value. One needs to take into consideration how cyclical the earnings are as well. There is a fair amount of trade-offs to think through as well, mostly between yield and growth, as well as how sustainable that yield and growth really are.

5. Once a company makes it through those screens, we have to review it qualitatively as well. This is subjective, and part art, part science. The most brilliant equity analysts can pick up how a company makes money, if it has any competitive advantages, and would be able to generate high returns on investment in the future, given industry trends. However, it is important not to fall prey to narrative bias and wishful thinking and spend the time looking for qualitative factors that justify a company for which the numbers tell a different story.


With this out of the way, it's time to look at the reason for today's post - reviewing actual dividend increases from last week. 

Over the past week there were six companies that managed to increase dividends, which also have at least a ten year track record of annual dividend increases. The companies include:

General Dynamics Corporation (GD) operates as an aerospace and defense company worldwide. It operates through four segments: Aerospace, Marine Systems, Combat Systems, and Technologies.

The company increased quarterly dividends by 7.60% to $1.42/share. This is the 30th year of consecutive annual dividend increases for this dividend aristocrat. 

Over the past decade, the company has managed to increase dividends at an annualized rate of 9.07%.

The company has managed to grow earnings from $7.56/share in 2014 to $12.14/share in 2023. The company is expected to earn $14.65/share in 2024.

The stock sells for 18.60 times forward earnings and yields 2.08%.


Horace Mann Educators Corporation (HMN) operates as an insurance holding company in the United States. The company operates through Property & Casualty, Life & Retirement, and Supplemental & Group Benefits segments.

The company increased quarterly dividends by 3% to $0.34/share. This is the 16th consecutive year the Board has increased the annual shareholder cash dividend.

Over the past decade, the company has managed to increase dividends at an annualized rate of 5.40%.

Between 2014 and 2023 the company's earnings went from $2.50/share to $1.09/share. The company is expected to earn $3.19/share in 2024. The earnings stream is volatile.

The stock sells for 11 times forward earnings and yields 3.87%.


Kadant Inc. (KAI) supplies technologies and engineered systems worldwide. It operates in three segments: Flow Control, Industrial Processing, and Material Handling. 

The company increased quarterly dividends by 10.30% to $0.32/share. This is the 12th consecutive annual dividend increase for this dividend achiever.

Over the past decade, the company has managed to increase dividends at an annualized rate of 16.28%.

The company has managed to increase earnings from $2.61/share in 2014 to $9.92/share in 2023. Kaidant is expected to earn $9.98/share in 2024.

The stock sells for 32.76 times forward earnings and yields 0.35%.


QUALCOMM Incorporated (QCOM) engages in the development and commercialization of foundational technologies for the wireless industry worldwide. It operates through three segments: Qualcomm CDMA Technologies (QCT); Qualcomm Technology Licensing (QTL); and Qualcomm Strategic Initiatives (QSI).

The company increased quarterly dividends by 6.30% to $0.85/share. This is the 22nd consecutive annual dividend increase for this dividend achiever.

Over the past decade, the company has managed to increase dividends at an annualized rate of 9.25%.

Between 2014 and 2023, the company managed to grow earnings per share from $4.73/share to $6.47/share. 

The company is expected to earn $9.70/share in 2024.

The stock sells for 17.60 times forward earnings and yields 2%.


SpartanNash Company (SPTN) distributes and retails grocery products in the United States of America. It operates through Wholesale and Retail segments.

The company increased quarterly dividends by 1.20% to $0.2175/share. This is the fourteenth consecutive annual dividend increase for this dividend achiever.

Over the past decade, the company has managed to increase dividends at an annualized rate of 9.40%.

The company's earnings per share basically went nowhere over the past decade. The company earned $1.56/share in 2014 and $1.53/share in 2023.

The company is expected to earn $2.01/share in 2024.

The stock sells for 10.23 times forward earnings and yields 4.23%.


Trinity Industries, Inc. (TRN) provides rail transportation products and services under the TrinityRail name in North America. It operates in two segments, Railcar Leasing and Management Services Group, and Rail Products Group. 

The company increased quarterly dividends by 7.70% to $0.28/share. This is the fifteenth consecutive annual dividend increase for this dividend achiever.

Over the past decade, the company has managed to increase dividends at an annualized rate of 15.32%.

Earnings per share over the past decade actually declined from $4.35/share in 2014 to $1.27/share in 2023. The company is expected to generate $1.42/share in 2024.

The stock sells for 18.50 times forward earnings and yields 4.26%.


Relevant Articles:

- Four Dividend Growth Stocks Rewarding Shareholders With Raises Last Week


Wednesday, March 6, 2024

Start investing with the end goal in mind

Planning your retirement is one of the most challenging exercises in the world. There are plenty of ways, methods and advisors, who try to influence your choice with formulas and narratives. Some of these methods may work, while others will fail most of the time. Everyone’s situation is different of course, which further complicates things. The investment path and environment will vary from individual to individual as well. For example, your experiences will be different if you started retirement in 2012, versus starting retirement in 2007 or 1929.

Some lucky investors have the benefit of pensions in addition to social security. This alone can be enough to quit your job, albeit in your late 50s or early 60s.

Others plan to rely on a combination of investments, and withdraw a portion for so many years. There are hundreds of articles, papers and opinions on the best way to live off investments. I have read a portion of them, but have decided to largely focus elsewhere.

For my retirement, I plan to live off the dividends generated from my equity portfolio.

Dividend payments are more stable than share prices and the potential for capital gains, which makes them an ideal source of income for retirement. Historically, US dividend growth has exceeded the rate of inflation. This means that dividend income not only maintains purchasing power, but increases it over time.

I go a step further by focusing on companies that can grow those dividends, have adequate dividend payout ratios and are available at attractive valuations. By assembling a portfolio of carefully selected dividend growth stocks, I can easily see how much income my retirement portfolio generates right from day one. When I compare my dividend income to my expenses, I know exactly where I am on my journey towards financial independence or retirement. This is the so called the divided crossover point.

Dividends also take into consideration current valuation available to investors today. A lot of retirees rely on historically backtested studies that show how they will not outlive their money by withdrawing 4% of their portfolios annually. Unfortunately, some of these studies are using data from historical periods that may not be directly comparable with todays situation. If the data was for periods where bond yields were above 4% and dividend yields were above 4%, it may make sense that withdrawing 4% from a portfolio was sustainable ( even when prices largely went nowhere, such as the period between 1965 and 1982). The question is whether it makes sense to withdraw 4% from a portfolio today, during a time when bond yields are closer to 2% and equity dividend yields are closer to 2% as well.

These studies attempt to make up the difference by hoping for quick annual gains in principle. Unfortunately, it is difficult to predict what share or bond prices will do in the short run when you need to sell. While the yields themselves will vary, the dividend payments will not. Relative to share prices, dividend payments look like an ocean of stability. They make retirement planning to be a breeze.

I have decided to focus on dividend income, since it is easier to predict. For example, I am reasonably certain that Johnson & Johnson will pay at least $3.60/share in annual dividend income over the next 12 months. Chances are high that this dividend king will continue growing the dividend at least once during the same time as well. However, I have no idea whether the stock price will go above $150/share or below $100/share. If you plan to sell shares to pay for retirement expenses, it makes a difference whether you sell at a high price or at a low price. Unfortunately, no one can predict share prices. On the other hand, predicting dividend incomes is much easier. This is why I focus on dividend income for my retirement planning, and ignore share price fluctuations. I think like a business owner.

Again, I focus on analyzing each individual business, in order to determine if it can safely pay and grow dividends per share over time. I also focus on underlying valuations, in order to lock in a set rate of dividend yield today. I also go a step further, by trying to build out a diversified portfolio consisting of as many companies as possible that meet my basic criteria. Besides diversification by sector, I also try to diversity over time, in order to build my positions in these companies more gradually.

The focus on dividend income makes the transition from earning a paycheck to retirement much easier. When you work, you receive a paycheck once or twice per month. When you create a dividend portfolio, you generate dividend income that replaces those paychecks. In effect, with dividemd investing you are creating your own paycheck to live off in retirement.

Compared to my paycheck however, dividend income is more reliable because it is generated from at  least 30 – 60 global businesses, and not a single client ( employer). My job is to diversify, build over time, buy at the right valuation and ensure that the underlying profit machine is humming along nicely. When you start with the end in mind, and you keep at it, you can track your progress until you reach your own dividend crossover point.

To put things in perspective, I believe that it is relatively easy to create a diversified portfolio today with a starting yield of roughly 3%. This portfolio will have adequate sector allocations, and could be built out over a period of several months to an year, in order to take advantage of dollar cost averaging and the variety of different opportunities available at different periods. If you place $1,000 in such a portfolio, it can easily generate $30 in annual dividend income today. If history is any guide, this dividend income will increase over time at or above the rate of inflation.

An investor who needs $30,000 in retirement income can get there by potentially investing $1,000,000. Few investors have this type of cash ready to be deployed however. The mindset of viewing income and expenses through the lens of dividend income investing however, can change you. The investor can see that if they only require $24,000 in annual retirement income, they need a nest egg with $800,000 today. However, if they need $36,000 to live off in retirement, they will need a nest egg worth $1,200,000.

For each extra dollar of extra expenses in retirement, our investor will have to save $33 extra dollars. These 33 extra dollars, invested at a 3% starting yield will generate one dollar in dividend income for ever. If you increase expenses by $10,000/year, prepare to come up with an extra $333,000. This can take quite a few years of hard work to accumulate.

Alternatively, if our investor manages to cut expenses, they can rest assured that for reducing each dollar in annual expenses, they need to save and invest $33 less. If you decrease expenses by $10,000/year, you can retire with a nest egg that is $333,000 less than originally expected. If you are the average person, the fact that you need to save a lower amount for retirement means that you can also retire earlier.

As I mentioned above, few investors have $1,000,000 to invest right from the start. However, if you choose to invest regularly over a set period of time, you can get there within a reasonable period of time. The inputs will vary from individual to individual of course, because different investors can invest different amounts every month. The conditions will vary as well.  For example, when I invested in 2008 - 2010, it was much easier to find quality companies yielding 4% than it is today.  However, if you keep investing regularly, keep reinvesting dividends, and manage to put money to work in a diversified portfolio of quality blue chip dividend payers, you may reach that goal in a reasonable amount of time.

For example, lets look at how long it would take you to reach $30,000 in annual dividend income if you invest $3,000 per month in dividend growth stocks. Let's assume an average yield of 3% and an average dividend growth of 6%/year. We will assume automatic reinvesting of dividends.

At this rate, it would take the investor roughly 14 years to reach their goals. This is not bad.
If money is tight, and our investor can only afford to put $2,000 to work each month, they can reach their goal within roughly 17.50 years. If the investor can put only $1,000 to work every month, they will be able to generate $30,000 in annual dividend income after 24 years. I used the spreadsheet in this article to calculate the different scenarios.

In this article, I showed that it pays to focus on the end goal in mind when investing for retirement. The first step involves coming up with a target monthly dividend income to pay for retirement expenses. The next step involves creating a dividend strategy that allows the investor to build a dividend portfolio that showers them with a growing stream of dividend income. Depending on current condition, investors can see how each dollar they invest generates a certain amount of dividend income. As a result, investors can see their progress towards the coveted dividend crossover point after every new investment they make, after every dividend increase and after every single action to reinvest dividends. By investing regularly, keeping investment costs low, and sticking to their strategy through thick or thin, our investors have a very high chance of hitting their retirement objectives.

Thank you for reading!

Relevant Articles:

Dividend Investing Resources I Use
Financial Independence Is Easier to Model with Dividends
- What drives future investment returns?
Generate a retirement paycheck with these dividend stocks


Monday, March 4, 2024

17 Dividend Growth Stocks Raising Shareholder Distributions

As a shareholder, there are two ways to make profits from a stock. 

The first way is when you sell your stock for a gain, after it has increased above your purchase price. The downside is that once you sell your stock, you will not be able to participate in any further upside. If you hold patiently however, you will experience a surge in net worth if the business succeeds. 

The second way is when a stock you own distributes a dividend. A company typically distributes a dividend after carefully evaluating its business needs. If a business does not find enough good opportunities to deploy profits at high rates of return, then the rational thing to do is to distribute it to shareholders. Some businesses are able to both grow earnings and dividends. 

There are over 530 businesses in the US, which have managed to increase dividends to shareholders for at least a decade. I try to monitor most of them, in an effort to review existing holdings, and uncover companies for further research. 

My monitoring process involves different steps. I regularly screen the investable universe, using my criteria, before reviewing promising candidates. I also review some major news like filings and dividend increases as well for a narrower view of the universe.

For example, last week, there were 58 US companies that raised dividends. Of those companies, only 17 had managed to grow dividends for at least 10 years in a row. You can view this list below:


As part of my review, I look at the size of the increase and compare it to the five and ten year average. I also review the trends in earnings per share, in order to determine if the track record of dividend growth was from a solid base.

I like reviewing trends in payout ratios, in order to determine dividend safety. This of course is best done in conjunction with reviewing of earnings per share.

Last but not least, I also review valuation, in order to determine if a company is worth reviewing today for a potential acquisition.

You may like this old analysis of Eaton Corporation from 2015, on the steps I take to review a company.

Relevant Articles:

- 16 Dividend Growth Companies That Increased Dividends Last Week

- 25 Dividend Growth Stocks For Further Research

- 25 Companies Rewarding Shareholders With Raises


Popular Posts